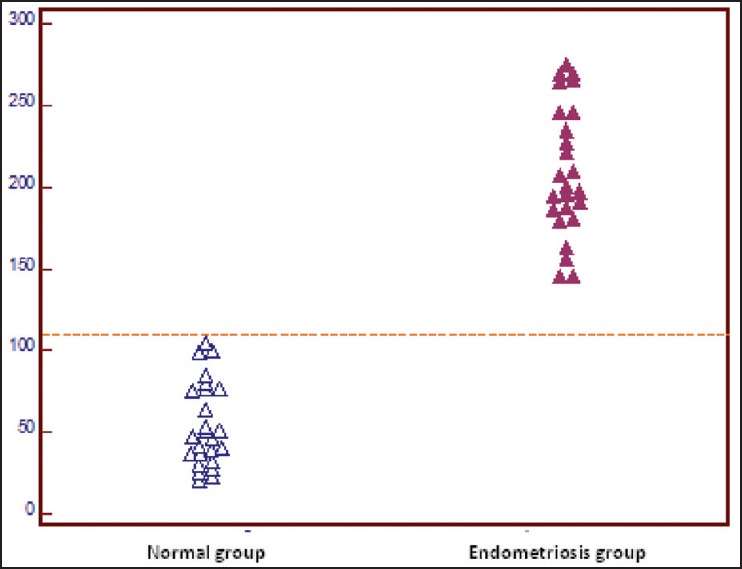
Figure 3.

Dot plots of interleukin-1 (IL-1) concentrations in patients with endometriosis and healthy group. The respective cut-off value as determined by receiver-operated curves is shown by the dashed horizontal line. The level for IL-1 in cervico-vaginal fluid in the endometriosis group differed significantly from those in the control group (P < 0.0001)
