Figure 2.

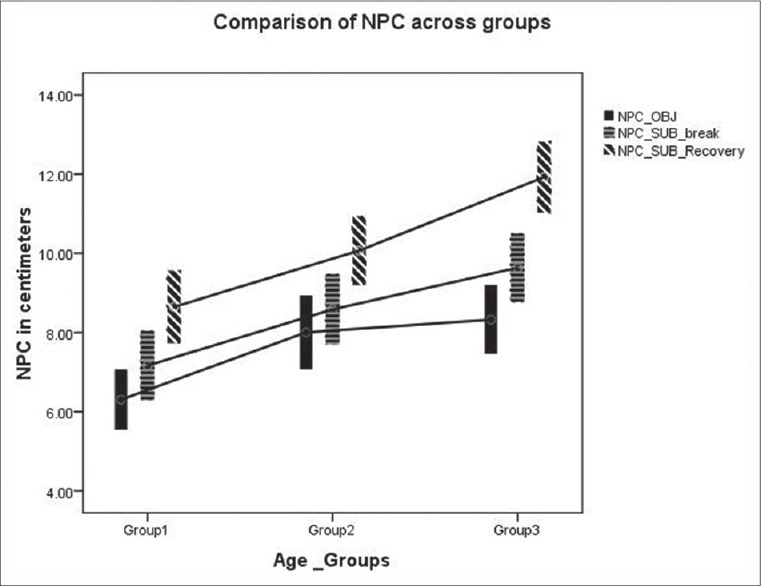
Comparison of near point of convergence across three age groups. The lower and upper end of the bar in the error plot denotes the 95% confidence interval limits and mid-point denotes the mean value

Comparison of near point of convergence across three age groups. The lower and upper end of the bar in the error plot denotes the 95% confidence interval limits and mid-point denotes the mean value