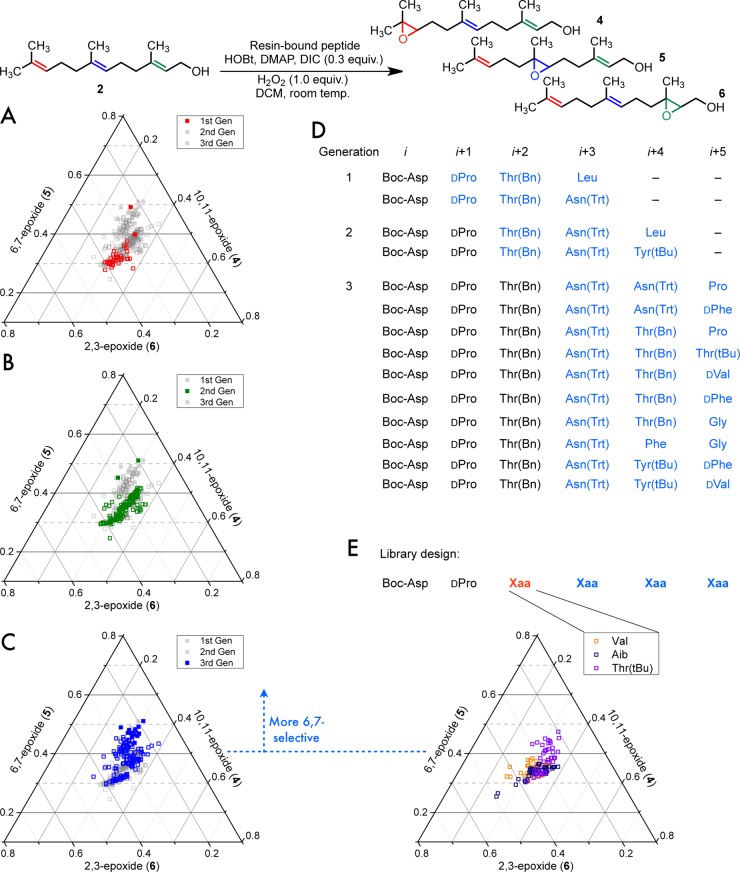
Figure 1.
(A–C) Ternary plots showing an overlay of peptide selectivities from successive generations of 6,7-selective peptides, where each axis represents the fraction of the total monoepoxide: (A) the first library demonstrating 6,7-selectivity (first generation, red); (B) the first biased library for 6,7-selectivity (second generation, green); (C) second biased library (third generation, blue). Points that are higher (further away from the triangle base) are more 6,7-selective. The highlighted generation from each plot is in the solid color in the foreground atop the other library generations in the background. Solid markers indicate peptides that were sequenced. (D) List of a portion of sequenced peptides from each library generation (shown with solid markers in A–C). Residues shown in blue indicate were picked from the pool of variable residues from their particular library. (E) Selectivity with amino acids at the i + 2 position, which can be compared to the library with i + 2 Thr(Bn) directly to the left (C, third generation, blue). Product ratios were measured by GC. In all of the on-bead screening studies, the formation of diepoxides was intentionally limited through the use of 0.3 equiv of DIC, resulting in analysis of low-conversion reaction mixtures.

