
Figure 4.
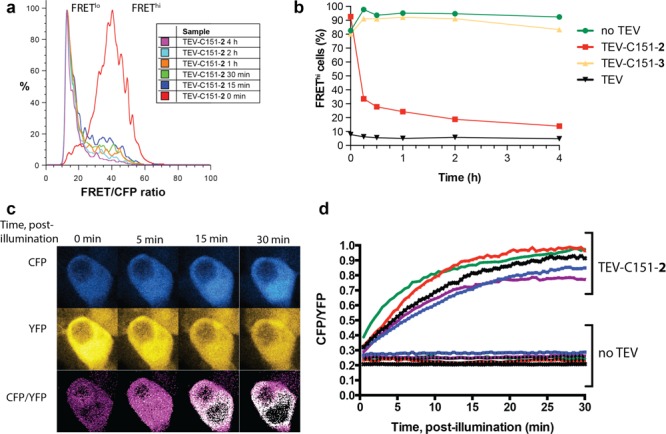
Following TEV protease photoactivation by FRET in mammalian cells. (a) Histograms of FRET/CFP ratio in mCherry positive cells determined by FRET-FACS. (b) Percentage of FREThi population, for mCherry positive cells, at time points postillumination confirms rapid TEV protease photoactivation. (See SI, Figures S4a–f for detailed FACS analysis). (c) Single-cell analysis of TEV protease photoactivation by live-cell fluorescent imaging. Fluorescent confocal micrographs showing an increase in CFP/YFP fluorescent intensity ratio after illumination in a representative cell expressing FRET sensor and TEV-C151-2. (d) Analysis of TEV protease activation in individual cells expressing the FRET sensor and TEV-C151-2 or cells expressing only the FRET sensor.