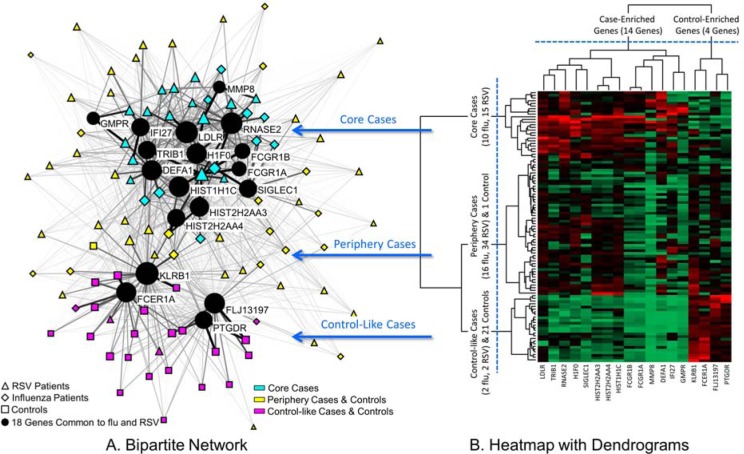
Figure 1.
A. A bipartite network (automatically laid out by the Kamada-Kawai algorithm14) shows how 18 genes (circular nodes) co-occur across 101 subjects (triangle, diamond and square nodes). The size of the nodes is proportional to the sum of the edge weights (representing normalized expression) that connect to them, and the thickness of edges is proportional to gene expression values. Therefore subjects with high total expression have large nodes, and higher expression is represented by thicker edges. The network has an overall distinct cluster topology that separates most cases from the controls, in addition to a core-periphery topology of cases. B. A heatmap with dendrogram generated through hierarchical clustering helped to identify the boundaries of three subject clusters, which were superimposed onto the network using colored nodes to denote cluster membership.

