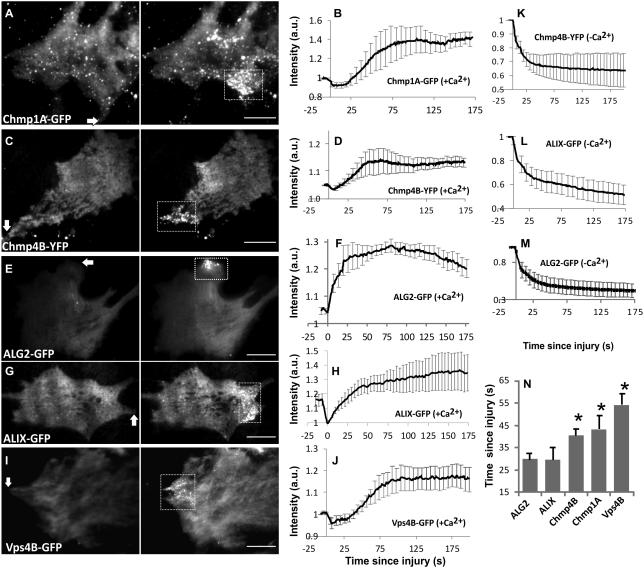
Figure 2. Injury triggers recruitment of ESCRTIII and accessory proteins at the site of repair.
C2C12 myoblasts expressing fluorescently tagged (A,B) Chmp1A, (C,D) Chmp4B, (E,F) ALG-2, (G,H) ALIX, and (I,J) Vps4B proteins were injured using a pulsed laser. Representative TIRF images (A,C,E,G,I) show change in the level of ESCRT and accessory proteins at the injured cell membrane. The kinetics of accumulation of these proteins at the injured cell membrane when cells were injured in the (B, D, F, H, J) presence or the (K, L, M) absence of extracellular calcium. Images show the cells 5s prior to injury (Pre-injury) and at the time point following injury when the intensity of the respective protein at the site of injury has reached its peak value (Post-injury) and the plots show average of n>4 cells each. (N) Kinetics of protein accumulation at the injured cell membrane was imaged and the chart shows average time each protein takes to initiate accumulation following injury (n>10 cells each). Arrows on the image show the site of injury and boxes mark the site of repair where proteins accumulate. Scale bars represent 10μm and (*) represents P-value <0.03 (paired 2-tailed t-test with ALG-2) and error bars represent SE.

