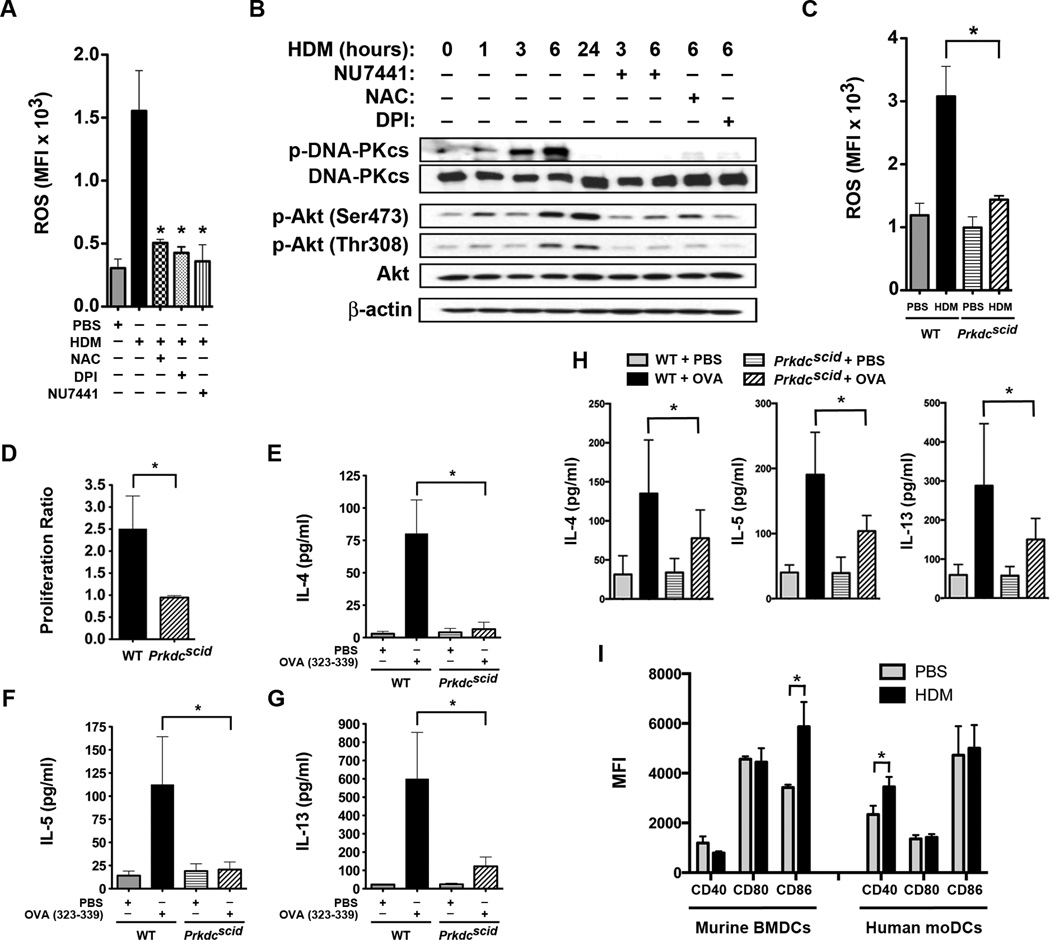
Figure 1. House Dust Mite induces Phosphorylation of Dendritic Cell DNA-PK via Generation of Reactive Oxygen Species.
A. Mean fluorescence intensity (MFI) of intracellular reactive oxygen species (ROS) generated by human monocyte-derived dendritic cells (moDC) stimulated with house dust mite (HDM) (100 µg/ml) for 1 h with or without NAC (2 mM), DPI (10 µM) or NU7441 (0.5 µM) (n = 3 – 5, * P< 0.01 vs. HDM, one way ANOVA with Bonferroni multiple comparison test). B. Western blots of HDM-stimulated human moDC proteins with or without NU7441, NAC or DPI for 1 to 24 h (see Supplementary Figure 2 for images of full original blots). Image is representative of 4 blots. C. MFI of intracellular ROS generated by bone marrow-derived dendritic cells (BMDC) from wild type (WT) and Prkdcscid mice stimulated with HDM (100 µg/ml) for 1 h (n = 3, * P< 0.01, WT + HDM vs. Prkdcscid + HDM, one way ANOVA with Bonferroni multiple comparison test). D. CD11c+ BMDC from Prkdcscid and WT mice were pulsed with the ovalbumin (OVA) 323–339 peptide and incubated at a 1:5 ratio with CSFE-labeled CD4+ DO11.10 T cells for 4 days. OVA-specific proliferation is presented as proliferation index (n = 8, * P = 0.0011, Mann Whitney test, pooled data from 3 independent experiments). E – G. Th2 cytokines released by co-cultures of OVA 323–329-pulsed BMDCs and CSFE-labeled DO11.10 CD3+/CD4+ T cells (n = 3, *P < 0.05, WT + OVA vs. Prkdcscid + OVA, one way ANOVA with Bonferroni multiple comparison test). H. Co-cultures of BMDCs from Prkdcscid and WT mice incubated at a 1:5 ratio with splenic CD4+ T cells from WT mice sensitized to full-length OVA. Co-cultures were treated with PBS or OVA (1 µg/ml) for 4 days and Th2 cytokines were quantified (n = 7, * P < 0.05). Pooled data from 2 independent experiments. I. MFI of CD40, CD80 and CD86 cell surface expression by murine BMDCs (n = 6 mice) and human moDCs (n = 10 mice) stimulated with or without HDM (100 µg/ml) for 24 h. Pooled data from 2 independent experiments (* P < 0.05, Mann Whitney test).

