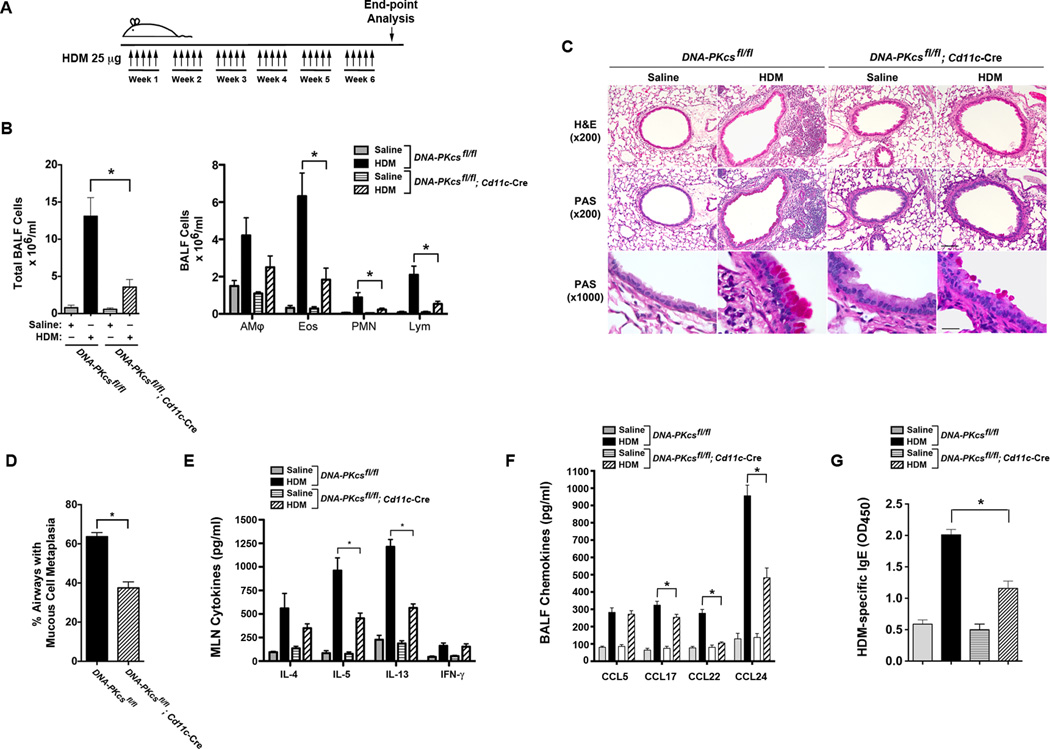
Figure 5. HDM-challenged CD11c-specific DNA-PKcs Knockout Mice Have Impaired Allergen-mediated Inflammation.
A. DNA-PKcsfl/fl and DNA-PKcsfl/fl; CD11c-Cre mice were sensitized and challenged by daily administration of HDM 25 micrograms or PBS, 5 days a week, for 6 weeks. End-point analysis was performed 72 h after the last administration of HDM. B. The number of total BALF inflammatory cells and inflammatory cell types (alveolar macrophages (AMϕ), eosinophils (Eos), lymphocytes (Lymph) and neutrophils (PMN)) from saline- and HDM-challenged DNA-PKcsfl/fl; CD11c-Cre mice were compared to DNA-PKcsfl/fl mice, which served as a control (n = 8 – 15 mice, * P < 0.01, DNA-PKcsfl/fl; CD11c-cre + HDM vs. DNA-PKcsfl/fl + HDM, one way ANOVA with Bonferroni multiple comparison test). C. Representative histologic lung sections stained with hematoxylin and eosin (H&E) or periodic acid-Schiff (PAS) are shown. Scale bars denote 100 µm for the x200 images and 20 µm for the x1000 images. D. Quantification of mucous cell metaplasia. (n = 9 mice, *P < 0.0001, DNA-PKcsfl/fl; CD11c-cre + HDM vs. DNA-PKcsfl/fl + HDM, unpaired t test). 55 + 3.8 airways were analyzed per mouse. E. Cytokine secretion by ex vivo cultures of mediastinal lymph node cells that had been re-stimulated with saline or HDM (100 µg/ml) (n = 7 – 13 mice, *P < 0.001 DNA-PKcsfl/fl; CD11c-cre + HDM vs. DNA-PKcsfl/fl + HDM, one way ANOVA with Bonferroni multiple comparison test). F. BALF chemokines. (n = 8 – 12 mice, *P < 0.01, CD11c-cre + HDM vs. DNA-PKcsfl/fl + HDM, one way ANOVA with Bonferroni multiple comparison test). G. Serum HDM-specific IgE. (n = 8 – 16 mice, *P < 0.0001, CD11c-cre + HDM vs. DNA-PKcsfl/fl + HDM, one way ANOVA with Bonferroni multiple comparison test). Results are pooled data from two independent experiments.

