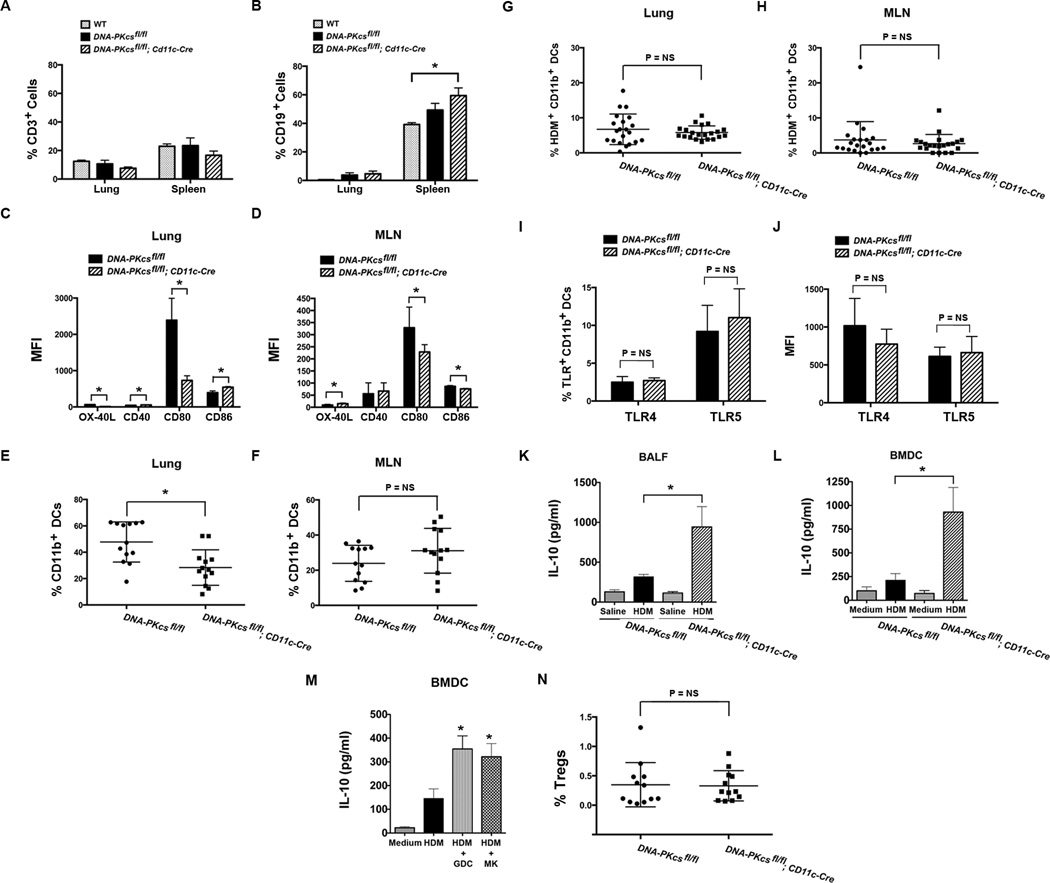
Figure 6. Characterization of HDM-challenged CD11c-specific DNA-PKcs Knockout Mice.
A & B. The percentage of CD3+ T cells (A) and CD19+ B cells (B) in lungs and spleens of naïve, wild type (WT) C57BL/6 mice, which is the parental strain of both DNA-PKcsfl/fl mice and DNA-PKcsfl/fl; CD11c-Cre mice (n = 6, *P < 0.05, one-way ANOVA with Sidak’s multiple comparison test). Pooled data from two independent experiments. C & D. Mean fluorescence intensity (MFI) of OX-40L, CD40, CD80 and CD86 expression by CD11c+/MHCIIhi/SSClo DCs in lungs (C) and mediastinal lymph nodes (MLN) (D) of HDM-challenged DNA-PKcsfl/fl mice and DNA-PKcsfl/fl; CD11c-Cre mice (n = 5 – 6 mice, * P < 0.05, Mann Whitney test). E & F. The percentage of CD11c+/MHCIIhi/SSClo DCs that express CD11b in the lungs (E) and MLNs (F) of HDM-challenged DNA-PKcsfl/fl mice and DNA-PKcsfl/fl; CD11c-Cre mice (n = 13 mice, * P < 0.0025, Mann Whitney test). G & H. Uptake of HDM by CD11c+/MHCIIhi/SSClo/CD11b+ DCs in the lungs (G) and MLNs (H) of DNA-PKcsfl/fl mice and DNA-PKcsfl/fl; CD11c-Cre mice 72 hours after administration of HDM extract (50 µg) labeled with Alexa Fluor® 647 (n = 21 mice, P = NS, unpaired t test). I & J. The percentage of CD11c+/MHCIIhi/SSClo/CD11b+ DCs that express TLR4 or TLR5 (I) and the MFI of TLR4 and TLR5 expression (J) by CD11c+/MHCIIhi/SSClo/CD11b+ DCs in the lungs of DNA-PKcsfl/fl mice and DNA-PKcsfl/fl; CD11c-Cre mice (n = 8 mice, P = NS, Mann-Whitney test). K. BALF IL-10 (n = 9, * P < 0.01, DNA-PKcsfl/fl; CD11c-Cre + HDM vs. DNA-PKcsfl/fl + HDM, one way ANOVA with Bonferroni multiple comparison test). L. IL-10 secretion by bone marrow-derived dendritic cells (BMDCs) (n = 7 – 9, * P < 0.01, DNA-PKcsfl/fl; CD11c-Cre + HDM vs. DNA-PKcsfl/fl + HDM, one way ANOVA with Bonferroni multiple comparison test). M. IL-10 secretion by BMDCs stimulated with HDM (100 ug/ml) with or without Akt inhibitors, GDC0068 (GDC) and MK2206 (MK), both at 1 uM for 24 hrs (n = 8, * P < 0.05, HDM vs. HDM + Akt inhibitor, one way ANOVA with Bonferroni multiple comparison test). Pooled data from two independent experiments. N. The percentage of CD3+/CD4+/CD25+/Foxp3+ regulatory T cell (Tregs) in MLNs from saline- and HDM-challenged DNA-PKcsfl/fl; CD11c-Cre mice were compared to DNA-PKcsfl/fl mice, which served as a control (n = 12 mice, P = NS, Mann Whitney test).

