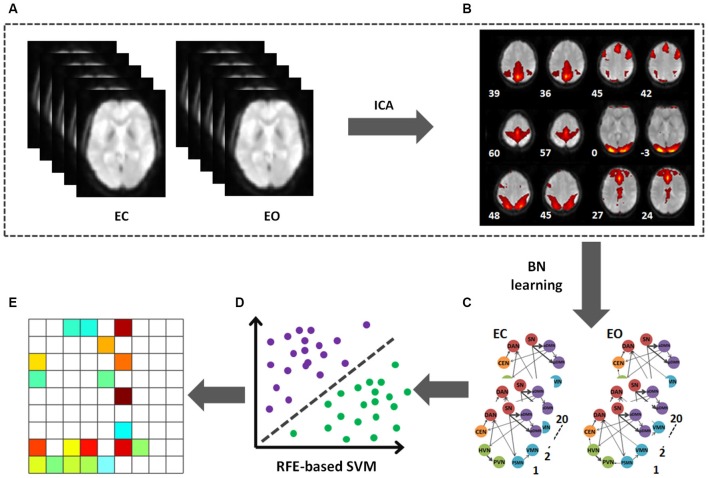
Figure 1.
Flowchart of data processing. (A) The preprocessed data after band filter of two conditions (EC and EO). (B) The mean ICs. (C) BN connectivity patterns on the selected 9 ICs in EO and EC. (D) The RFE-based SVC was used to identify the discriminative pattern. (E) The pattern able to effectively discriminate between the EO and EC states.

