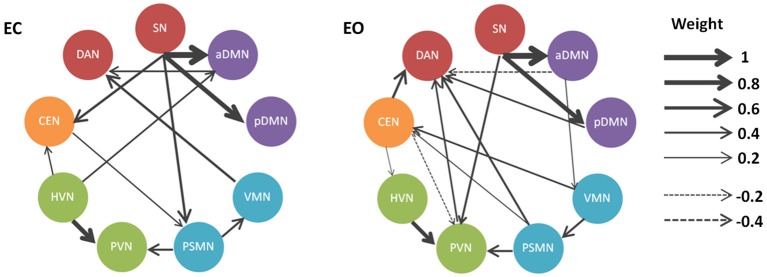
Figure 3.

Directional connectivity patterns related to the EO and EC states in the BN model. The RSNs (sphere radius = 6 mm) are graphically connected to depict their conditional dependencies in a BN model. Only connections that survived the significance testing (p < 0.05) are shown. Solid and dashed arcs correspond to the positive and negative connections, respectively. Line width is proportional to the connection weights.
