
Figure 5.
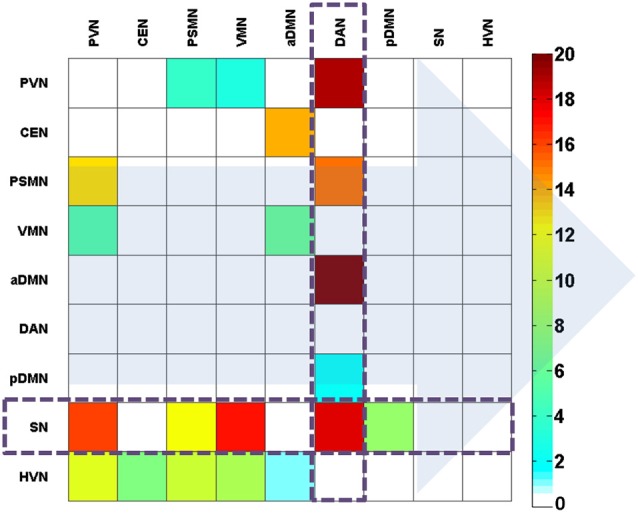
The effectively discriminative pattern of the EO and EC states based on the weight coefficients of the direct connections. The background arrows represent the direction of connections. The color bar represents the contribution in the discrimination between the states. The color describes the level of contribution in classification.