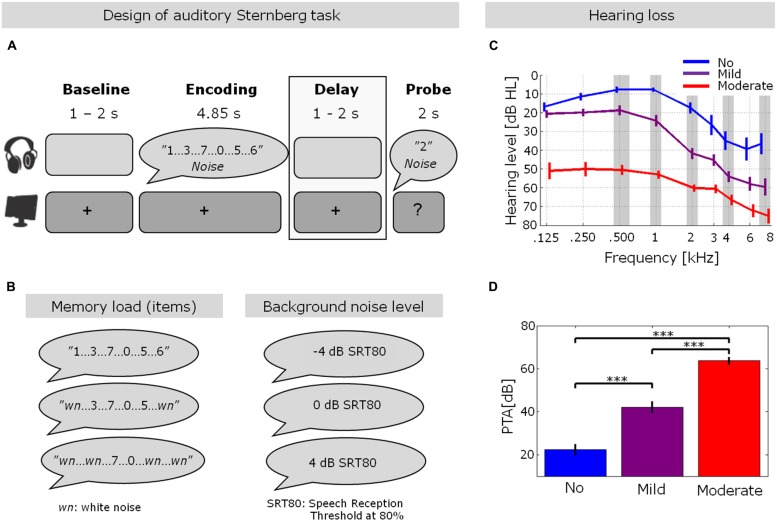
FIGURE 1.
Hearing thresholds and experimental design. (A,B) Trial design in the auditory Sternberg task. After an initial silent baseline period, participants were presented with a varying number of spoken digits (2, 4, or 6; see Experimental procedure for details) embedded in three different individually adjusted background noise levels (–4, 0, or 4 dB relative to the individual speech reception threshold at 80%, SRT80). After a silent delay period, participants indicated whether a probe digit was presented during the encoding. The gray box highlights the stimulus-free delay period, which was the focus of the EEG data analysis in the present study. (C) Pure-tone hearing thresholds for the three hearing loss (HL) groups (blue: no HL, purple: mild HL, red: moderate HL). Error bars indicate ±1 SEM. (D) Pure-tone average across frequencies highlighted with gray shading in (C) (0.5, 1, 2, 4, and 8 kHz) for the three groups of HL (***p < 0.001; one-way ANOVA with Fisher’s LSD post hoc analyses). These PTA values are also shown in Table 1. Error bars indicate ±1 SEM. The figure is adapted from Obleser et al. (2012).

