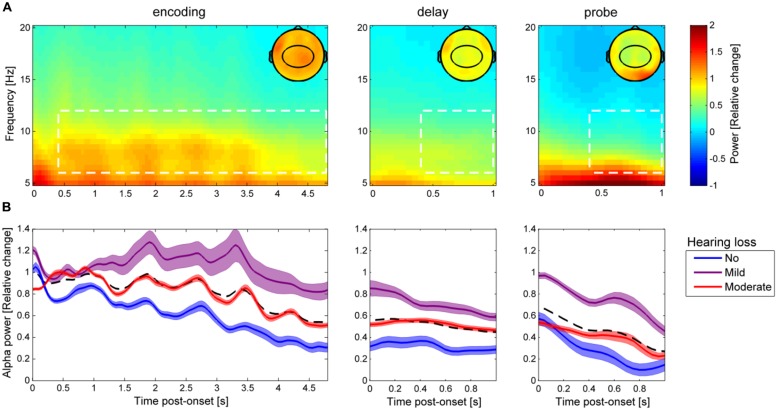
FIGURE 3.
Alpha power dynamics during the auditory Sternberg task. (A) Grand-average time-frequency power representation during encoding, delay, and probe (averaged across all participants, in all nine experimental conditions, and for all 31 centro-parietal electrodes highlighted in the topographic maps). The topographic maps show the spatial distribution of alpha power (6–12 Hz) averaged over the time-frequency data highlighted in the white dashed boxes, which were used for statistical analyses. (B) The bold lines show average alpha power in the three time periods (encoding, delay, and probe) separately for the three groups of HL (blue: no HL, purple: mild HL, red: moderate HL), with the colored areas indicating ±1 SEM. The black dashed line indicates the average over the three HL groups.

