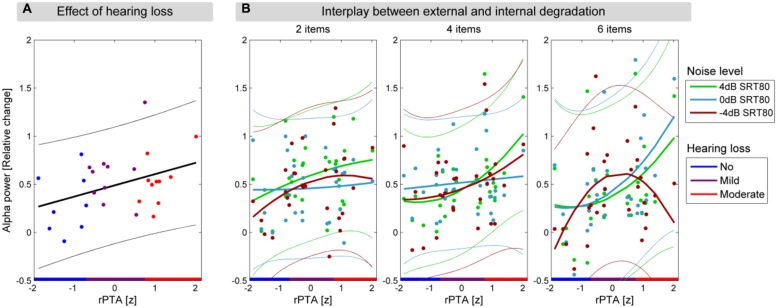
FIGURE 4.
Hearing loss affects alpha power in the delay period. (A) The significant linear relationship between alpha power in the delay interval and rPTA (p = 0.048). The regression line is shown with a solid black line, and the 95% confidence interval of the regression is shown in thin lines. (B) The three panels show the significant interaction between memory load, background noise level, and rPTA-squared, illustrated with quadratic fits between alpha power and rPTA for each background noise level (green: 4, light blue: 0, and dark red: -4 dB SRT80). Each panel shows one of the three memory load conditions (2, 4, and 6 items to be remembered) with alpha power during the delay interval as a function of rPTA with HL groups indicated on the x-axis (blue, no HL; purple, mild HL; red, moderate HL).

