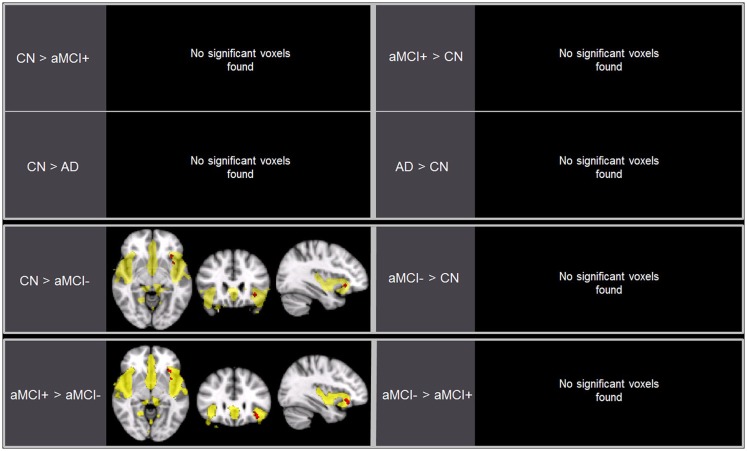
Figure 3.
Brain regions displaying significant differences (in red) in the salience network (SN) between the groups using voxel-wise comparisons (p < 0.005, uncorrected for multiple comparisons) marked by the overall average SN in yellow (p < 0.001, uncorrected). Results are superimposed on the MNI-152 T1 1-mm brain template.

