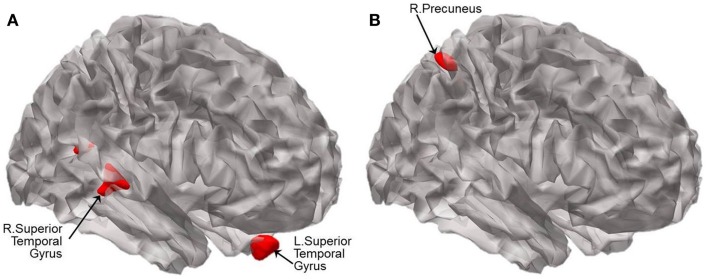
Figure 4.
Statistical parametric maps showing the results of analysis of covariance of VBM at p < 0.005 (uncorrected). Brain regions displaying significant differences in brain volume are shown in red between (A) CN and aMCI−, and between (B) CN and aMCI+. Results are superimposed using the cortex_20484.surf template in SPM8. The peak voxels of clusters meeting the p < 0.001 (uncorrected) cluster-wise criterion for the contrasts are listed in Table 4.

