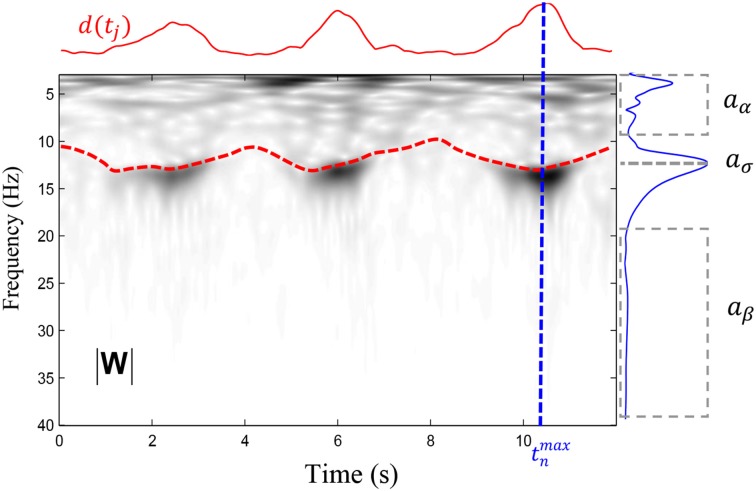
Figure 2.
Illustation of the variables entering in the computation of sigman as defined in (6). The time-frequency plane (|W|), in gray levels, is represented by the modulus of wavelet coefficients computed for frequencies between 4 and 40 Hz with 0.1 Hz resolution. The red dashed line shows the ridge computed in the 10–16 Hz band whereas the solid red line shows the d(tj) function defined in (4). A maximum has been detected at time tmaxn and the variation of the coefficients (i.e., the instantaneous spectrum) at the time tmaxn is shown by the solid blue line. From this spectrum, we extract the average amplitude in two intervals (shown by dashed boxes comprising respectively the low and the high frequencies) to obtain and . We further take the maximal amplitude in the spindle band to obtain .

