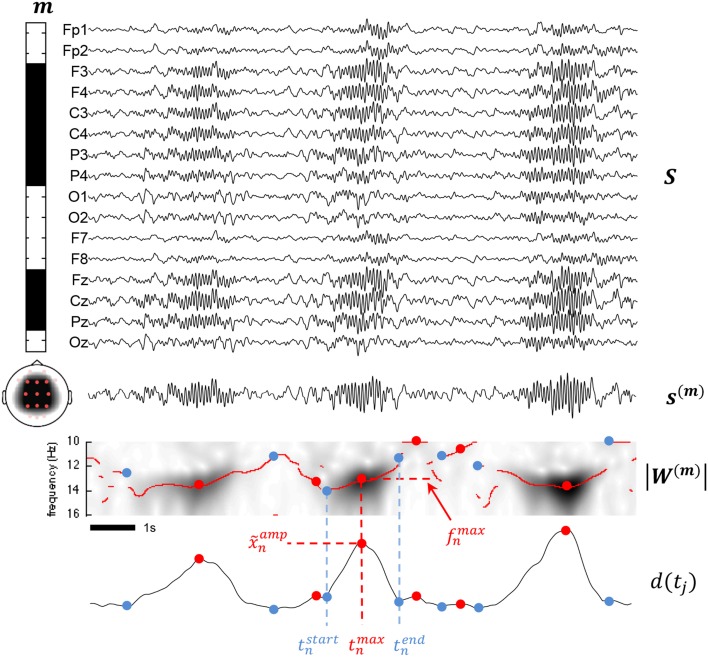
Figure 3.
This figure summarizes various aspects of the proposed methodology. The montage defined by the m vector is illustrated by the leftward band displaying binary weights including frontal, parietal, and central channels and excluding the other channels from the mixture. Below the band, a scalp map shows the topological coverage of this montage (red dots for included electrodes, pink for excluded). At the right of the montage band, all available channels are stack in a matrix S. The mixture signal s(m) is obtained by matrix multiplication of m and S as described in (1). Applying the CWT to s(m) and taking the modulus, we obtain a time-frequency map |W(m) as shown. Using (4) on |W(m), we compute the d(tj) detection function used to determine the times tstart, tmax, and tend. ampn is obtained as d(tmaxn) and fmaxn as fi with .

