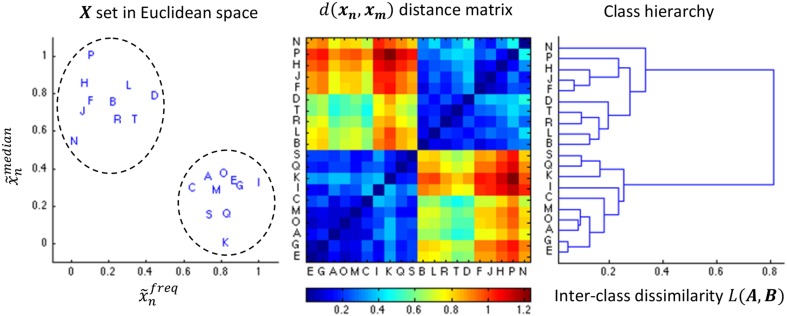
Figure 4.
Illustration of the AHC algorithm. An example of 20 events characterized by the medial position and the frequency (both normalized to the unit range) is shown in the leftward pane. The middle pane shows the color coded distance matrix corresponding to these 20 events. Finally, the right most pane shows the resulting dendrogram. The dendrogram is sequentially split into more classes in a top-down fashion, stopping the decomposition as soon as we reach two classes since (in this specific example) both contains 10 samples such that .

