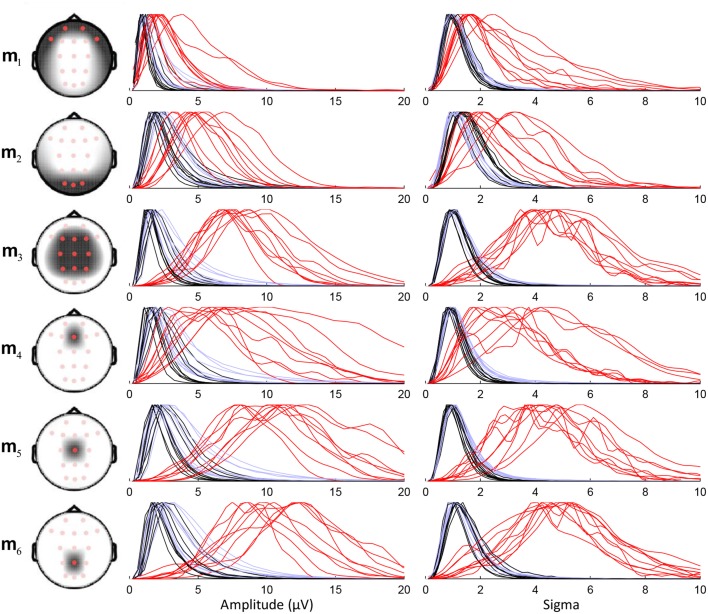
Figure 5.
Density plots with normalized maximal amplitude for the distribution of sensitive detection features (amplitude and sigma index) for six different montages. The head drawings show the topographical coverage of each montage. Feature distributions are plotted as three separate lines per subject: red for detected spindles corresponding with expert scoring, black for events scored as spindles by the algorithm in REM epochs only, and light blue for detected events during REM and NREM sleep.

