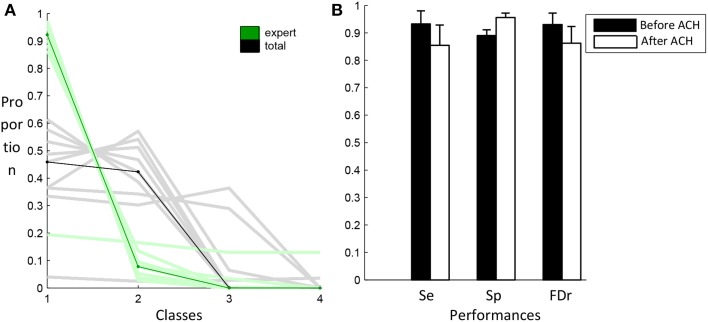
Figure 7.
Results from the AHC algorithm. In (A), the distribution of expert (green) and total (black) events in the four first classes. Light color lines correspond to individual subjects whereas dark lines correspond to the median values across subjects. The graph in (B) compares the performance of the algorithm after the sensitivity phase (black) and after the specificity phase (white).

