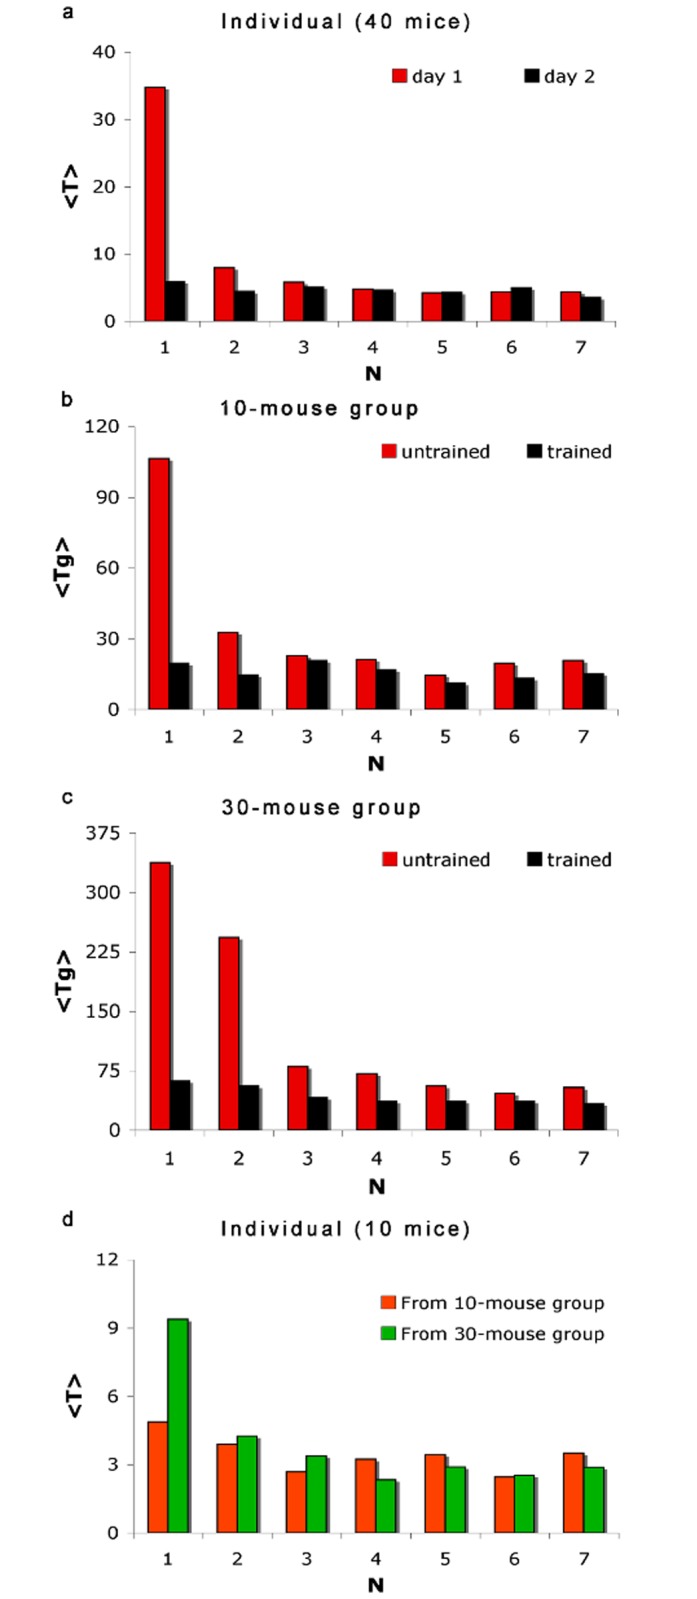
Fig 4. Evacuation Performance.

Average escape time (in sec) against trial number N obtained from: (a) Individual training of 40 mice (red), and 24 hours after training (black), (b) three 10-mouse groups, and (c) three 30-mouse groups. Shown in (D) is the average individual escape time ‹T(N)› of ten mice with no prior individual training, taken 6 weeks after participating in group trials.
