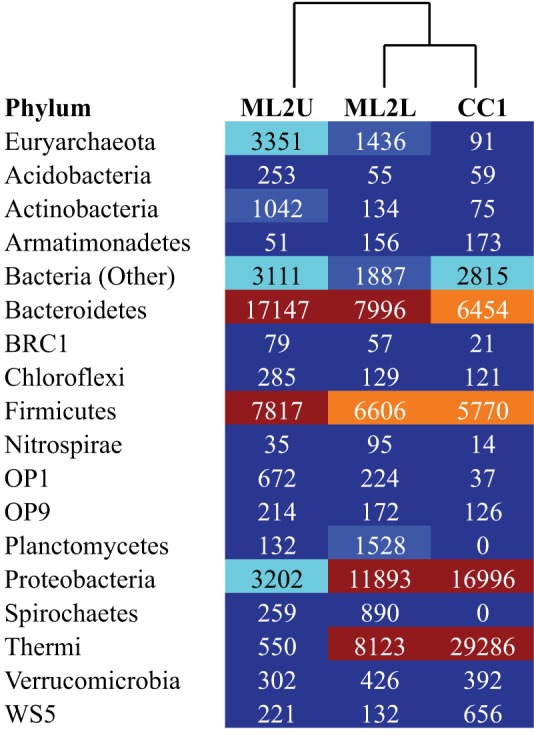
Figure 10.

Heatmap of OTUs separated to the Phylum level, with UPGMA-clustered dendrogram. Colors correlate to OTU density (dark red is the highest density, dark blue the lowest).

Heatmap of OTUs separated to the Phylum level, with UPGMA-clustered dendrogram. Colors correlate to OTU density (dark red is the highest density, dark blue the lowest).