
Figure 5.
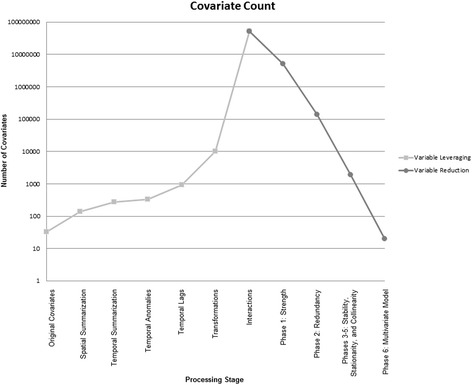
The number of covariates relative to the phase of analysis. The light grey points represent increasing covariates resulting from leveraging procedures, while the dark grey points represent the reduction in covariates by processing phase.
Official websites use .gov
A
.gov website belongs to an official
government organization in the United States.
Secure .gov websites use HTTPS
A lock (
) or https:// means you've safely
connected to the .gov website. Share sensitive
information only on official, secure websites.
The number of covariates relative to the phase of analysis. The light grey points represent increasing covariates resulting from leveraging procedures, while the dark grey points represent the reduction in covariates by processing phase.