
Figure 7.
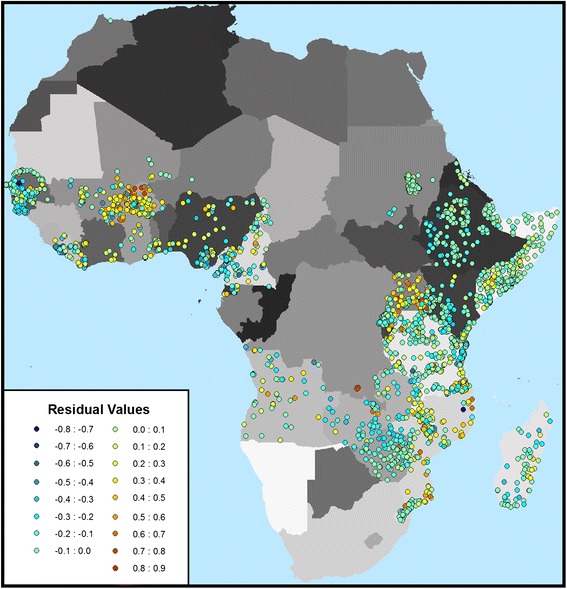
Map of the Pf PR residual values associated with clusters within the reserve dataset. The residuals were calculated for each reserve cluster (n = 3000) as the measured PfPR minus the modeled PfPR.
Official websites use .gov
A
.gov website belongs to an official
government organization in the United States.
Secure .gov websites use HTTPS
A lock (
) or https:// means you've safely
connected to the .gov website. Share sensitive
information only on official, secure websites.
Map of the Pf PR residual values associated with clusters within the reserve dataset. The residuals were calculated for each reserve cluster (n = 3000) as the measured PfPR minus the modeled PfPR.