
Figure 2.
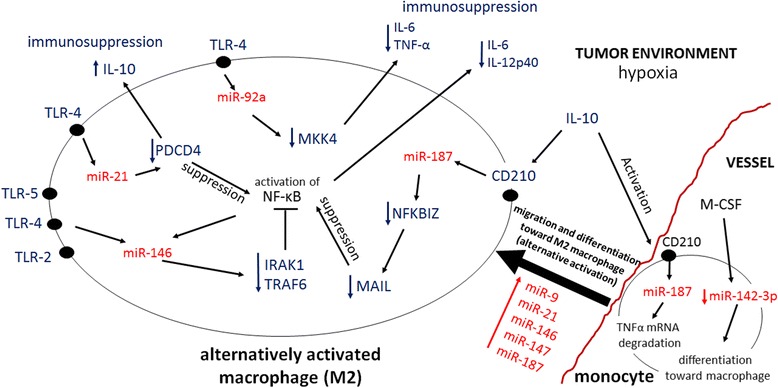
MicroRNA-mediated control of monocyte differentiation and tumor associated macrophages (TAMs) functions. All microRNAs are shown in red while gene targets and types of responses are shown in black. Arrows indicate directions of cause-and-effect relationships.