Abstract
There are opposite hypotheses on the effect of saccharin. Our aim was reviewing the influence of chronically ingested saccharin on the function and histological structure of liver and pancreas and all this in light of gender differences.
The rats were divided into control group – (Group C) and saccharin-treated group – (Group S) which was given a normal diet and 0.0005% saccharin in drinking water for 6 weeks. Liver and pancreas were histologically processed and quantitative histological analysis was performed. Glucose blood levels and plasma activities of aspartate transaminase (AST) and alanine transaminase (ALT), body weight, and food intake were analyzed.
Quantitative histological analysis determined that the values of diameter and volume density of both Langerhans islets and exocrine acini were significantly higher in S group, especially in males. AST levels were significantly higher in treated group. Glucose levels were higher in treated group, mainly due to the values of the female subgroup. Food intake was significantly higher in control group, while weight gain was higher in treated group. Treated males had significantly higher food intake and weight gain in comparison with treated females.
The data presented here suggests that chronic saccharin intake affects the examined parameters. Reported facts reflect various metabolic, hormonal and neural responses in males and females.
KEY WORDS: saccharin, pancreas, liver, glucose, transaminases, rats
INTRODUCTION
Due to the growing interest in healthy living and the increase in the incidence of obesity and diabetes, artificial sweeteners like saccharin have gained popularity [1, 2]. These non-nutritive sweeteners, better known as artificial, have no calories and typically exceed the sweetness of sucrose by a factor of 30 to 13.000 times [3]. Saccharin is the first artificial sweetener. It has been in use since 1900 and is used to sweeten various products like soft drinks, baked goods, jams, chewing gum, canned fruit, candy, dessert toppings and salad dressings, as well as cosmetic products (e.g., toothpaste, mouthwash, and lip gloss), vitamins, and medications [3]. After ingestion, saccharin is excreted unchanged via kidneys, and because it is not metabolized, the FDA (Food and Drug administration) considers this compound safe. It obtained FDA approval in 1970 [3]. However, a case of hepatotoxicity of saccharin with elevated concentrations of liver enzymes after oral administration of drugs containing the sweetener was reported in 1994 [4]. Subsequent re-exposure to pure saccharin provided further proof of its role in pathogenesis of liver damage. Furthermore, the introduction of noncaloric, high-intensity sweeteners is correlated with current obesity trends [5]. Several hypotheses on the effect of sweetness without energy have been posited so far. One of them states that energy-reduced sweet foods help preventing weight gain, while others suggest that ingestion of sweet beverages without energy increases appetite and subsequent food intake [1, 5, 6, 7, 8]. In humans, as well as animals, saccharin can elicit early insulin secretion - cephalic phase insulin release (CPIR), characterized by plasma insulin increase prior to food ingestion and the rise of blood glucose [9, 10, 11]. The excessive CPIR might play a role in the development of dietary obesity because of the capacity of insulin to boost adipose tissue lipogenesis and triglyceride uptake [9]. Manipulation of the taste of food can affect pancreatic exocrine secretion, digestive efficiency and food utilization as well. The two- to tenfold higher proteolytic activity in the small and large intestine and changes in intestinal pH were related to saccharin and could be explained by its postingestive effects [12]. Numerous studies provide conflicting results concerning the effect of artificial sweeteners on the intake of food and drinks and increase in body mass and glycemia; however, very few of them investigate the effect of artificial sweeteners on the morphology of the pancreas and liver during these processes. Hence, our goal was to examine the influence of chronically ingested saccharin on endocrine pancreatic function, subsequent blood glucose levels, and hepatic function by monitoring the activity of liver enzymes, as well as by analyzing the histological structure of both organs and all this while taking gender differences into consideration.
MATERIALS AND METHODS
Animals and experimental design
Female and male Wistar rats (180-250 g body weight) were housed at the Department of Pharmacology, Toxicology and Clinical Pharmacology, Faculty of Medicine in Novi Sad. Prior to the experiment, rats had free access to food and water and were kept under constant conditions of temperature (23±2°C) and humidity (50-60%). There were tree rats per cage on a 12-hour light/dark schedule. Rats were divided randomly into 2 groups (12 animals per group) and treated for 6 weeks as follows: control group – (Group C) was given normal diet (laboratory rodent chows) and drinking water; treated group – (Group S) was given normal diet and 0.0005% saccharin in drinking water. Body weight of each animal was measured weekly, while food intake of animals in each cage was measured every day. After 6 weeks, the rats were anesthetized by 25% solution of urethane in the dose of 4-5 mL/kg i.p. Blood samples were collected from the abdominal aorta, centrifuged (3000 rpm, 10 min) for serum aliquot and stored at -20°C until biochemical analysis were performed, while liver and pancreas were excised, rinsed with saline and weighted, after which they were subjected to histological procedures. The experimental procedures were approved by Ethical Committee for Animal Use in Experiments, University of Novi Sad.
Histopathologic studies
At the end of the treatment period, when rats were sacrificed, liver and pancreas were removed and fixed in 10% formalin saline. Sections were prepared and stained with hematoxylin and eosin (H&E).
Qualitative analysis
Qualitative analysis on the light microscopy was used to obtain information on general tissue morphology and pathological changes.
Quantitative analysis
Linear morphometry
Linear morphometry was performed on specimens of pancreas of both S and C group. Diameter of islets of Langerhans (dL) was measured using a linear scale which was incorporated in the eyepiece of the microscope. In order to provide results expressed in micrometers (μm) we multiplied the number of notches of the scale by index (k) determined for tenfold magnification. For each specimen the diameter of all islets of Langerhans on every second serial paraffin section was measured, and mean diameter for each of the groups was calculated as the average value of specimens inside the group.
Stereological analysis
Stereological analysis was performed on tissue of both groups, on every second serial paraffin section using a multi-purpose stereological grid M42. A total of 20 fields of vision per animal were analyzed under tenfold magnification (liver) and 40x magnification (pancreas) [13]. The volume densities of exocrine acini (VvA), islets of Langerhans (VvL), excretory ducts (VvD) and interlobar spaces (septae) (VvS) were determined in the pancreas. In liver, volume densities of lobules (VvLob), portal areas (VvP) and central veins (VvC) were determined.
Biochemical analyses
Serum activities of aspartate transaminase (AST) and alanine transaminase (ALT) were measured using a spectrophotometric method of commercial assay kit (Randox Laboratories LTD., Crumlin, United Kingdom). Blood glucose levels (BGL) were measured by using ACCU-Chek Active system (Roche Diagnostics, Mannheim, Germany).
Statistical analysis
All results are expressed as means ± SD. The comparison between two independent groups was made by Student’s t-test. Multiple group comparisons were performed by ANOVA. P values less than 0.05 were considered significant.
RESULTS
Qualitative analysis: Histological analysis of the pancreas specimens revealed minimal differences in C and S group. Specimens of the pancreas in both groups showed regular structure of the exocrine acini and uniform spread of the endocrine islets of Langerhans. In the S group islets of Langerhans seemed more numerous than in C group. In the S group small and medium excretory ducts appeared dilated and were filled with a dense acidophilic serous secretion (Figure 1, Figure 2). No such feature was registered in the C group (Figure 3, Figure 4). Specimens of the liver in both groups showed regular, lobular liver organization and normal arrangement of the hepatocytes. Within the hepatocytes of the S group vacuolization of the cytoplasm was observed (probably mild parenchymatous degeneration). Necrosis or apoptosis of hepatocytes were not detected (Figure 5). Quantitative analysis of pancreas: Linear morphometry determined significantly larger mean diameter of islets of Langerhans in the S group (p=0.002) (Table 1). Volume density of islets (VvL) showed significantly higher values in S group (p=0.028). Statistical analysis demonstrated significant differences between volume densities of exocrine acini between C and S group (p=0.012) (Table 1). Values of VvS and VvD showed no significant differences between C and S group. Significant differences were observed in VvA between treated males compared to treated females (p=0.0002) and control males (p=0.001). VvL of saccharin treated males was significantly higher than treated females (p=0.037) and males in control group (p=0.033). No statistically significant differences were observed in VvS and VvD between analyzed groups (Table 2). Quantitative analysis of liver: No statistically significant differences were observed after stereological analysis of the liver tissue (Table 3). The measurement of BGL in the 6th week of experimental procedure revealed higher values in the S group than in C group (p=0.029), mainly due to the values of the saccharin treated female subgroup (Table 4). Serum activity of AST was significantly higher (p=0.023) in S group, but no difference was observed between gender subgroups (Table 4). Food intake in the first week was equal in both groups, while from the second week onward, food intake in the control (C) group was significantly higher (p= 0.002) (Figure 6). In the S group, a significantly higher food intake was observed among male (Sm) animals than in the female subgroup (Sf) (p=0.001) (Figure 7). At the beginning of the experiment the saccharin-treated group had a slightly lower average weight, but the difference was not statistically significant. Although weight gain was higher in the S group compared to the C group during all 6 weeks, it was not statistically significant in relation to the weight gain in the C group (Figure 8). Weight gain in S group at the end of the experiment (compared to the weight at the beginning of the experiment), showed no statistical significance. There was a difference in favour of Sm subgroup whose average increase in body weight was 2.5 times higher than in females of the same group.
FIGURE 1.

Effect of saccharin on pancreas histology findings of saccharin treated males (HE, ×50)
FIGURE 2.
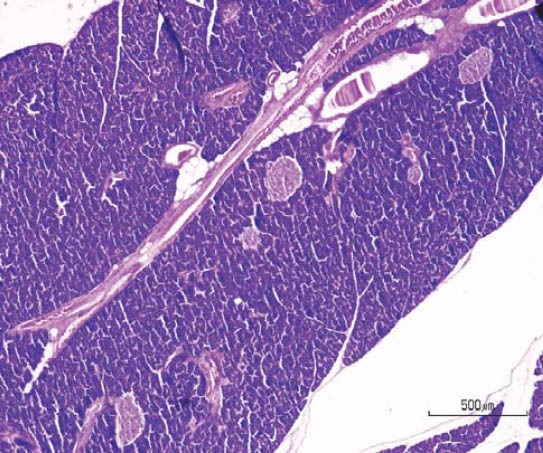
Effect of saccharin on pancreas histology findings of saccharin treated females (HE, ×50).
FIGURE 3.
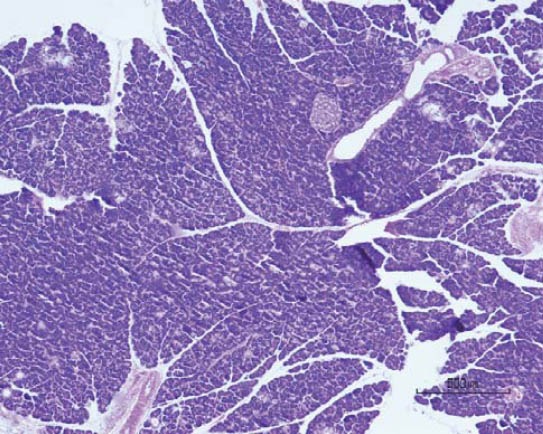
Microphotograph of pancreatic tissue of male animals in control group (HE, ×50).
FIGURE 4.

Microphotograph of pancreatic tissue of female animals in control group (HE, ×50).
FIGURE 5.
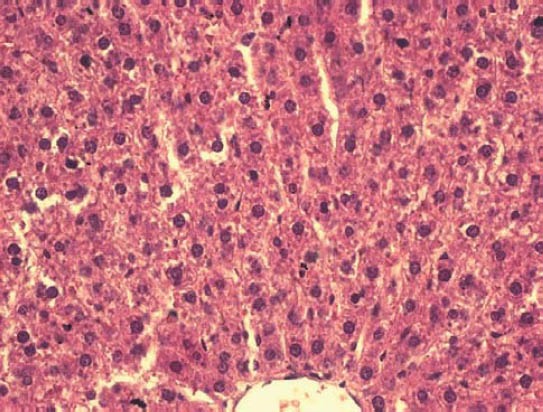
Histological sections of liver in animals of saccharin treated group (HE, ×400).
TABLE 1.
Median values of linear and stereological parameters in the pancreas of control and treated animals.
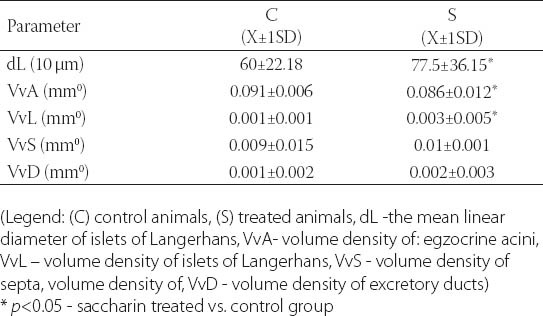
TABLE 2.
Values of stereological parameters of the pancreas compartments in male and female animals of control and treated group.

TABLE 3.
Median values of stereological parameters in the liver of control and treated animals.

TABLE 4.
Blood glucose levels, serum levels of alanine aminotransferase and aspartate aminotransferase in saccharine treated and control group.

FIGURE 6.
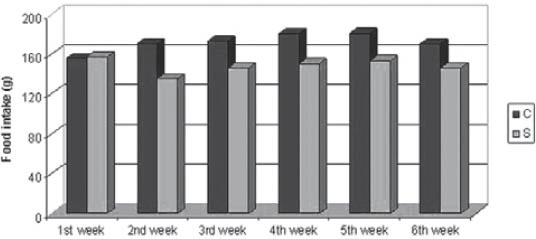
Food intake in control (C) and saccharin treated (S) group during a period of 6 weeks.
FIGURE 7.
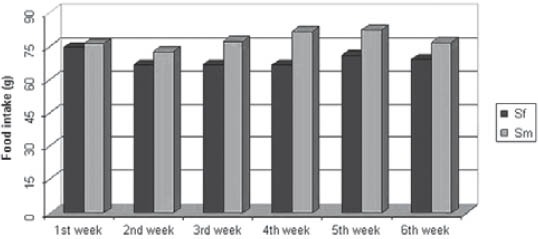
Food intake in female (Sf) and male (Sm) subgroups of saccharin treated group during a period of 6 weeks.
FIGURE 8.

Weight gain in control (C) and saccharin treated (S) groups during a period of 6 weeks.
DISCUSSION
Although research on saccharin has been extensive, the available data on the effect of chronic consumption of saccharin in literature is rather controversial [1, 5, 6, 7, 8]. In our experiment, chronic consumption of saccharin has led to a statistically significant increase in volumetric distribution of the endocrine pancreatic tissue in the treated group compared to the control one, and also in treated males compared to treated females, which was confirmed by quantitative analysis. Previously published data pointed out that saccharin is capable of inducing CPIR in rats [11], which in our study might have led to hypertrophy of islets and increased VvL in treated animals, especially in males. Sweet taste of food stimulates the body to expect energy; insulin is secreted in the cephalic phase and when the body does not receive the expected energy by intake of food or drink with artificial sweeteners, the result is hypoglycemia, increased appetite and greater food intake [2]. Increase in VvL in the treated group seems contradictory with the information that at the end of the experimental procedure the treated animals had statistically significantly higher BGL than the control group. Higher BGL in the S group probably comes from significantly higher values in the S females than C females. Similar data was obtained using artificial sweeteners in the diet of both experimental animals, and patients of both genders who suffered from diabetes [10]. All of this may call into question the justification for the use of artificial sweeteners in the diet of diabetic patients. It is notable that the highest VvL increase was in treated males (significantly higher than in females) and it was followed by a decrease in BGL. Increased VvL provides a complete explanation for the findings in the group of treated males: decreased BGLs increase the appetite and thus food intake, and this leads to a gain in body weight. Although C group in general had higher food intake, S group had a higher increase in body weight. A statistically significant increase in food intake and body weight gain was confirmed only in S group, in greater extent in males than in females. This data reflects the difference in metabolic, hormonal and neural responses occurring in males and females treated with saccharin. It is interesting that in most of the experiments performed on animals only male animals were used [1, 2, 9]. If animals of both sexes were used, the differences between sexes were not tested [12, 14]. On the other hand, in a human-based study on the effect of artificial sweeteners by Fowler et al. a higher long-term increase in body weight was observed in men than in women [6]. This can indicate either a different gender response on saccharin intake, or a different impact on appetite centres and insulin action. Some new clinical data shows, for the first time, the existence of gender differences in the appetite response to some substances; this is considered relevant for finding new gender-related weight-loss therapy [14]. In females, an increase of BGL was verified, but it was not followed by VvL enhancement. It is possible that during chronic saccharin consumption in females certain changes in the dominant action of insulin occur. These changes could include a greater role of insulin in the lipid metabolism and neural regulation of hunger [15]. This would suggest that insulin under the influence of saccharin acts differently in males and females, and that increased body weight in the S group can be explained by a higher triglyceride takeover and lipogenesis in females, and by hypoglycemia and increased food intake in males. Postingestive effects of saccharin are debatable, given the fact that it is not considered to be metabolized [3]. The introduction of saccharin in the diet of rats leads to disturbances in gut pH and proteolytic enzyme activity of the pancreas [12], and these occurrences have been linked with postingestive effects of saccharin, rather than its taste properties. In the pancreatic ducts of treated animals, from the smallest to the widest, a dense, eosinophilic secretion was found and it was not verified in the control group. As the bile was not analyzed in our study, it cannot be stated with certainty that the histological findings are the consequence of saccharin action. There are several possible explanations for the decrease in the volume density of exocrine pancreatic acini in the treated group. Apart from postingestive effects of saccharin on acini, another viable explanation is morphological compensation due to hypertrophy of endocrine islets. It appears that postingestive effects of saccharin are not limited solely to exocrine pancreas, but are also present in liver, since saccharin was previously confirmed to be an etiological factor of hepatotoxicity with increased activity of liver enzymes [4]. In our study the S group had a significantly higher AST level, without differences regarding the gender of animals. There are no stereological differences in the tissue of two groups, but some hepatocytes did show mild parenchimatous degeneration.
CONCLUSIONS
Our experiment was focused on the chronic effect of saccharin on both endocrine and exocrine pancreas, as well as its potential influence on liver; however, any future studies should certainly be based on the investigation of acute saccharin intake, dose- and time-dependent experiments, which would involve a modification of methods and experimental design.
ACKNOWLEDGEMENTS
This work was supported by The Ministry of Science and Technological development of the Republic of Serbia (grant number 41012 and 172050).
DECLARATION OF INTEREST
The authors declare no conflict of interest.
REFERENCES
- 1.Swithers SE, Baker CR, Davidson TL. General and persistent effects of high-intensity sweeteners on body weight gain and caloric compensation in rats. Behav Neurosci. 2009;123(4):772–780. doi: 10.1037/a0016139. [DOI] [PMC free article] [PubMed] [Google Scholar]
- 2.Polyák É, Gombos K, Hajnal B, Bonyar-Muller K, Szabo Sz, Gu-bicsko-Kisbenedek A, et al. Effects of artificial sweeteners on body weight, food and drink intake. Acta Physiol Hung. 2010;97:401–407. doi: 10.1556/APhysiol.97.2010.4.9. [DOI] [PubMed] [Google Scholar]
- 3.Whitehouse CR, Boullata J, McCauley LA. The potential toxicity of artificial sweeteners. AAOHN J. 2008;56(6):251–259. doi: 10.3928/08910162-20080601-02. [DOI] [PubMed] [Google Scholar]
- 4.Negro F, Mondardini A, Palmas F. Hepatotoxicity of saccharin. N Engl J Med. 1994;331:134–135. doi: 10.1056/NEJM199407143310220. [DOI] [PubMed] [Google Scholar]
- 5.Swithers SE, Davidson TL. A role for sweet taste: calorie predictive relations in energy regulation by rats. Behav Neurosci. 2008;122:161–173. doi: 10.1037/0735-7044.122.1.161. [DOI] [PubMed] [Google Scholar]
- 6.Fowler S, Williams K, Resendez R, Hunt K, Hazuda H, Stern M. Fueling the obesity Epidemic? Artificially sweetened beverage use and long-term weight gain. Obesity. 2008;16:1894–1900. doi: 10.1038/oby.2008.284. [DOI] [PubMed] [Google Scholar]
- 7.Pierce WD, Heth CD, Owczarczyk JC, Russell JC, Proctor SD. Overeating by young obesity-prone and lean rats caused by tastes associated with low energy foods. Obesity (Silver Spring) 2007;15(8):1969–1979. doi: 10.1038/oby.2007.235. [DOI] [PubMed] [Google Scholar]
- 8.Renwick AG. Intense sweeteners, food intake, and the weight of a body of evidence. Physiol Behav. 1994;55(1):39–143. doi: 10.1016/0031-9384(94)90021-3. [DOI] [PubMed] [Google Scholar]
- 9.Berthoud H, Trimble E, Siegel E, Bereiter D, Jeanrenaud B. Cephalic-phase insulin secretion in normal and pancreatic islet-transplanted rats. Am J Physiol. 1980;238:336–340. doi: 10.1152/ajpendo.1980.238.4.E336. [DOI] [PubMed] [Google Scholar]
- 10.Ferland A, Brassard P, Poirier P. Is aspartame really safer in reducing the risk of hypoglycemia during exercise in patients with type 2 diabetes? Diabetes Care. 2007;30:59. doi: 10.2337/dc06-1888. [DOI] [PubMed] [Google Scholar]
- 11.Just T, Pau H, Engel U, Hummel T. Cephalic phase insulin release in healthy humans after taste stimulation? Appetite. 2008;51:622–627. doi: 10.1016/j.appet.2008.04.271. [DOI] [PubMed] [Google Scholar]
- 12.Naim M, Brand J. Effect of unpalatable diets, food restriction and saccharin-adulterated diet on tryptic, chymotryptic, and amylolytic activity in pancreas, intestine and feces of rats. J Nutr. 1982;112:2104–2115. doi: 10.1093/jn/112.11.2104. [DOI] [PubMed] [Google Scholar]
- 13.Rajković V, Matavulj M, Johansson O. Studies on the synergistic effects of extremely low-frequency magnetic fields and the endocrine-disrupting compound atrazine on the thyroid gland. Int J Radiat Biol. 2010;86:1050–1060. doi: 10.3109/09553002.2010.501837. [DOI] [PubMed] [Google Scholar]
- 14.Davis C, Fattore L, Kaplan AS, Carter JC, Levitan RD, Kennedy JL. The suppression of appetite and food consumption by methylphenidate: the moderating effects of gender and weight status in healthy adults. Int J Neuropsychopharmacol. 2012;15(2):181–187. doi: 10.1017/S1461145711001039. [DOI] [PubMed] [Google Scholar]
- 15.Wells JCK, Siervo M. Obesity and energy balance: is the tail wagging the dog? Eur J Clin Nutr. 2011;65:1173–1189. doi: 10.1038/ejcn.2011.132. [DOI] [PubMed] [Google Scholar]


