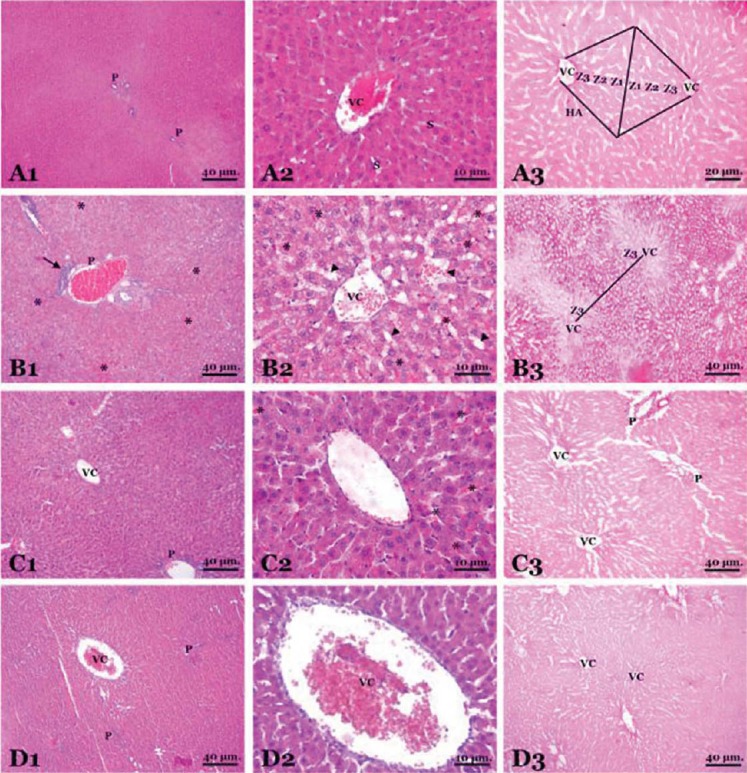
FIGURE 1.

Histopathological findings in groups (A micrographs on the first line is SHAM group, B micrographs on the second line is control group, C micrographs on the third line is intraoperative treatment group and, D micrographs on the fourth line is preoperative treatment group)
Figure Legend:
This panel of the rat liver is stained by hematoxylin and eosin (1st and 2nd micrographs of the each group on the left two columns of the panel) and Periodic Acid-Schiff reaction (3rd micrograps of the each group on the right column of the panel).
A micrographs shows the structure of the liver composed of tightly packed, pink-staining plates of hepatocytes (H). Portal tracts (P) which contain the main blood vessels, hepatic (centrilobular) venule “vena centralis” (VC), the sinusoids (S) are lined by flat endothelial lining cells. The hepatic asinus (HA) lies between two terminal hepatic venules and divided into zones 1,2 and 3 (Z1, Z2, Z3).
B micrographs, inflammatory cell infiltration (arrow) in the portal tract. Sinusoidal dilatation (arrow head) and congestion (*).
C, D micrographs, shows the diosmin treated groups in close morphology to the regular structure of liver except the mild congestion (*) in certain regions.
