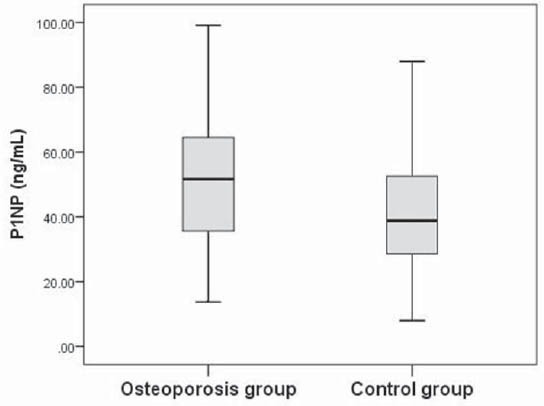
FIGURE 2.

Serum P1NP levels in the osteoporosis and control groups of postmenopausal females. The solid horizontal lines denote the median value, the box represents the 25% and 75% interquartile ranges and the whiskers represent minimum and maximum values.
