
Figure 2.
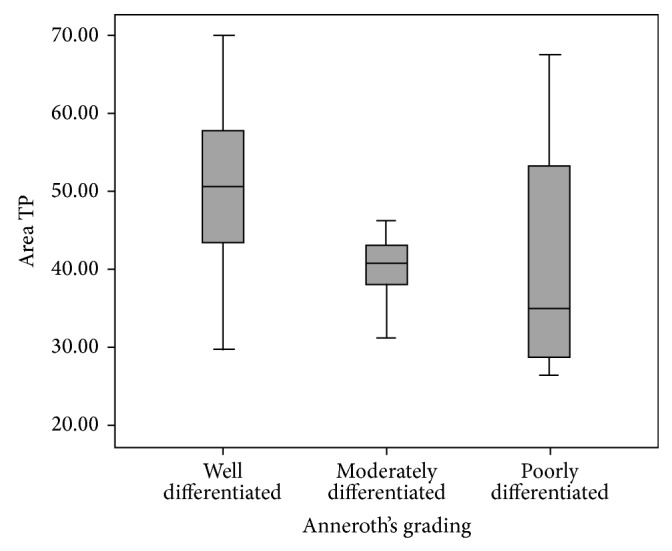
This graph depicts the relation of nuclear area at tumor proper with Anneroth et al. grading system in oral squamous cell carcinoma patients (graph depicted “tumour proper as TP”) (n = 32). The statistical significance was calculated using Chi-square test (value = 6.686) and statistical significance shown as ∗ P = 0.035.