Figure 3.

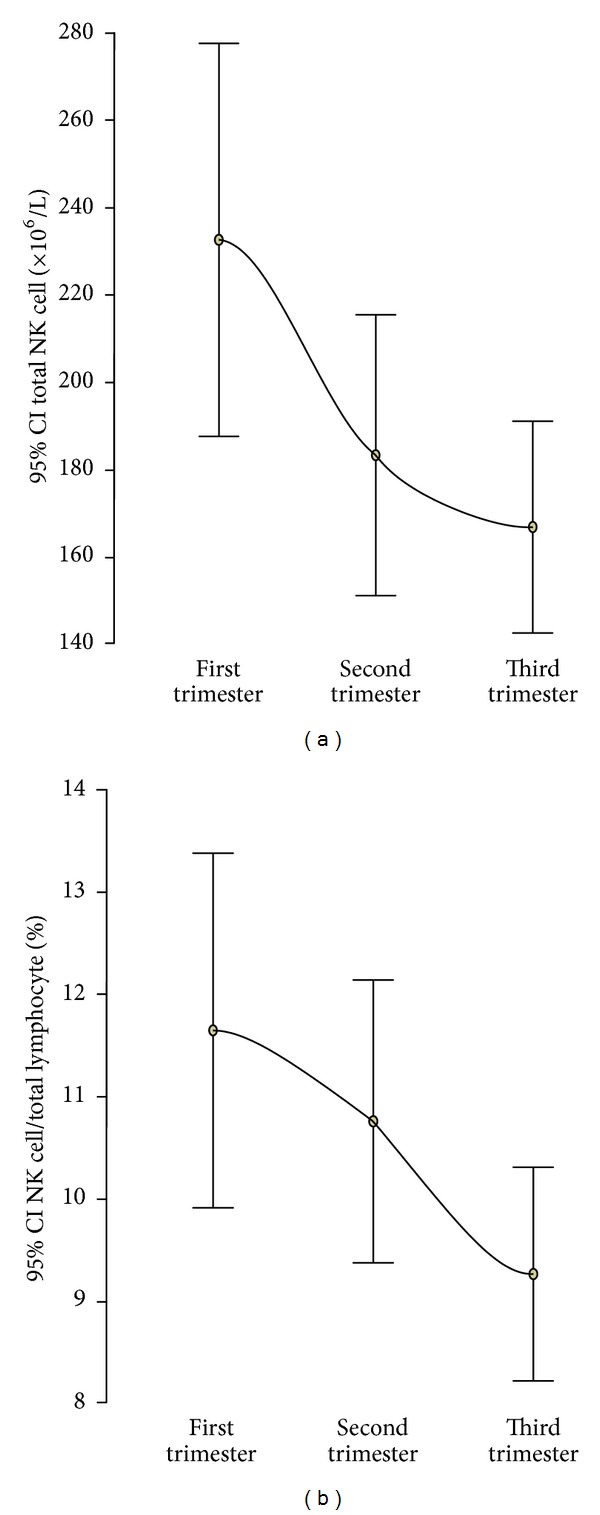
Error bar plots of the mean and 95% confidence interval of total natural killer (NK) cell count (a) and NK cell/total lymphocyte count (%) (b) in each trimester of pregnancy.

Error bar plots of the mean and 95% confidence interval of total natural killer (NK) cell count (a) and NK cell/total lymphocyte count (%) (b) in each trimester of pregnancy.