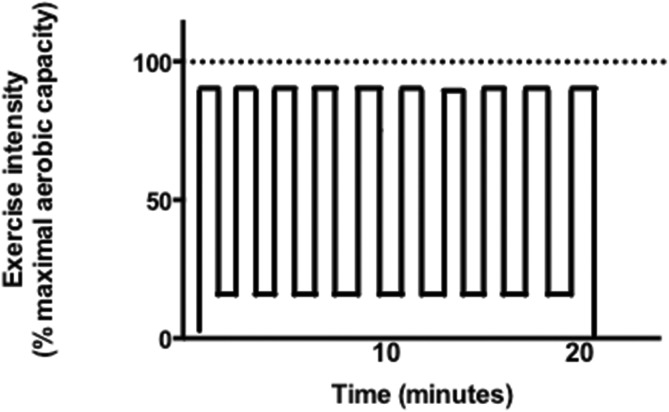
FIGURE 1.
Graphical representation of a typical HIIT protocol. Time is on the horizontal axis and exercise intensity, expressed relative to maximal aerobic capacity (dotted line), is on the vertical axis. The “on” portion of HIIT is typically >70% of maximal aerobic capacity, and these intervals can last from just a few seconds to several minutes. One protocol that has been shown to be feasible, time-efficient, and effective involves 10 × 1 minute at ∼90% maximal aerobic capacity separated by 1-minute rest periods. This protocol is depicted in the figure.

