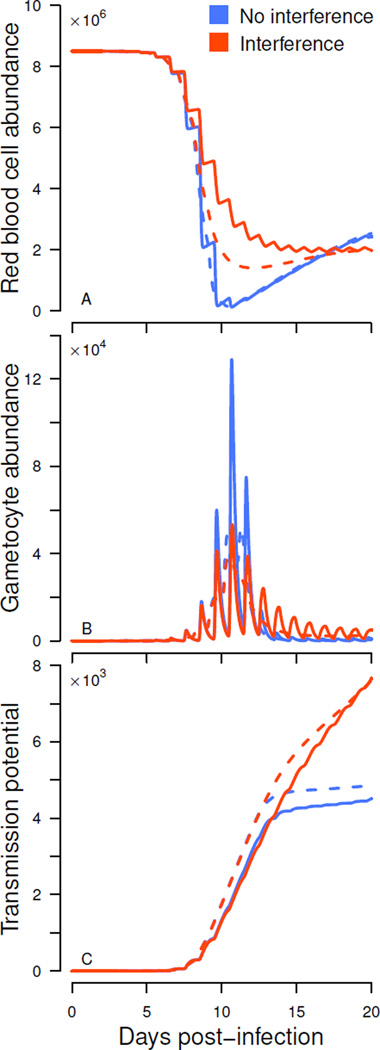
Figure 4.
Merozoite interference reduces anemia (A) and gametocyte abundance (B), but increases transmission potential (cumulative probability of transmission, C). Synchronized and asynchronous dynamics (solid and dashed lines, respectively) when merozoite interference is present (orange curve, q = 10) or absent (blue curve, q = 0). Gametocyte investment is set relatively high (c = 0.05) and immunity is absent (a = 0). The blue curves are identical to the red blood cell and gametocyte abundance shown in Fig. 3B, save that here they are plotted on a conventional rather than logarithmic scale.

