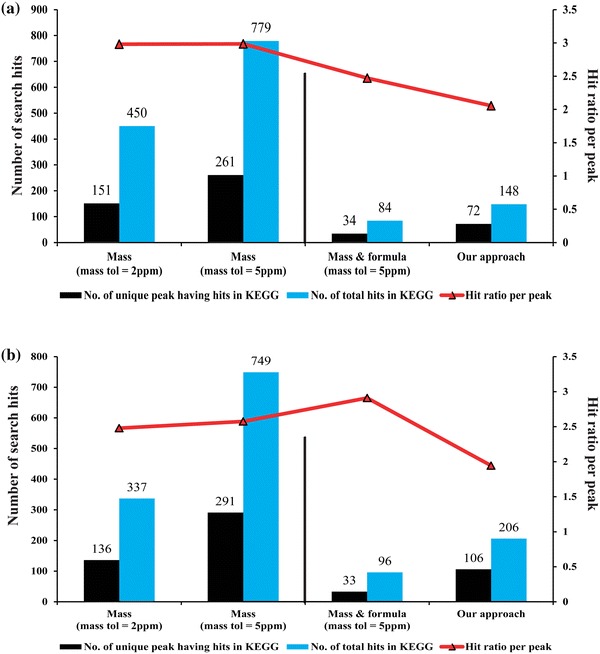
Fig. 3.

Performance evaluation of putative peak annotation of a R. rubrum at 20 min, b B. subtilis at 2 min. The performance of the putative peak annotation was indirectly evaluated by introducing a search HRPP, calculated by dividing the total number of hits in the KEGG database by the total number of input peaks. The black bars represent the total number of unique input peaks, and the blue bars represent the total number of search hits. The red line represents the performance as evaluated by HRPP. Two mass tolerances (2 and 5 ppm) were used for the simple search (bars on the left of the black line), and for others, a 5 ppm mass tolerance was used (bars on the left of the black line)
