Fig. 5.
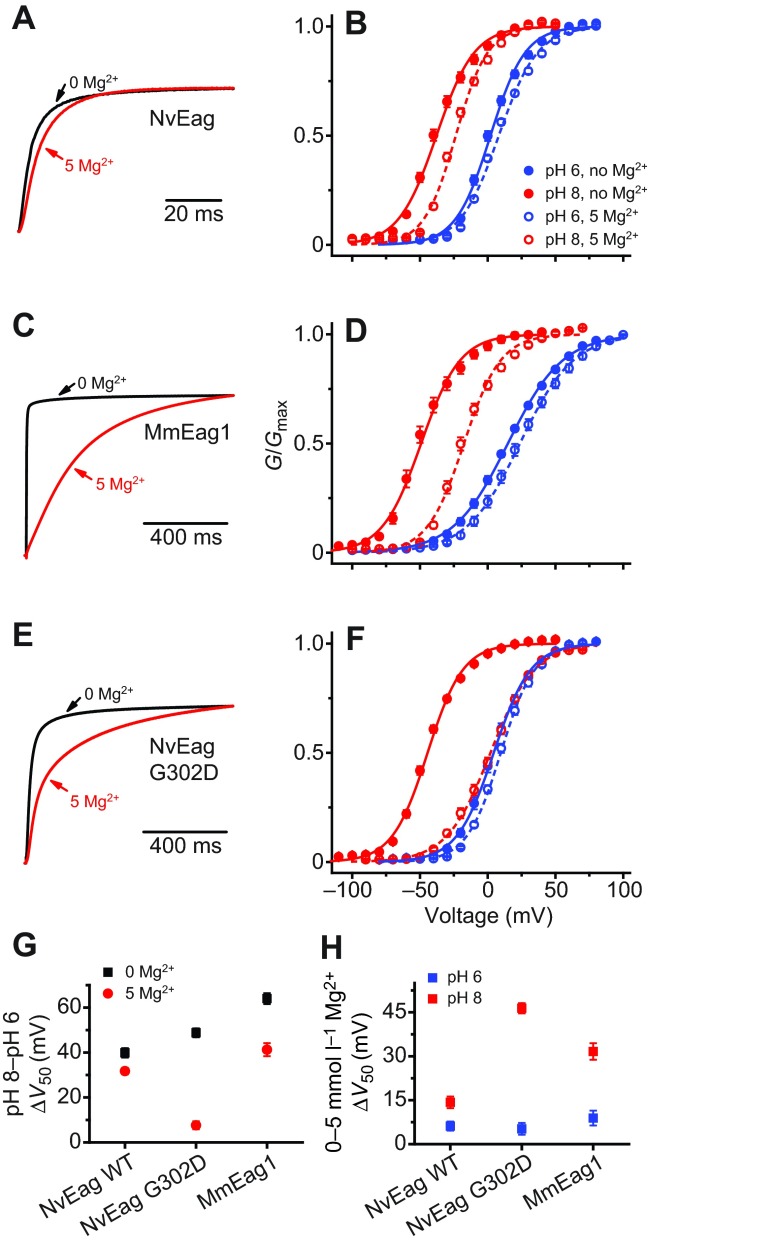
Mg2+ sensitivity in voltage activation is greatly reduced in NvEag. (A) Normalized current traces recorded in response to voltage steps to +20 mV (from a holding potential of −100 mV) for NvEag in 0 mmol l−1 Mg2+ (black) or 5 mmol l−1 Mg2+ (red). (B) NvEag voltage-activation (G–V) curves at pH 8 and pH 6 for NvEag in 0 mmol l−1 Mg2+ or 5 mmol l−1 Mg2+. Curves show fits with a single Boltzmann distribution (parameters in Table 1). Similar analyses are shown for MmEag1 (C,D) and NvEag G302D (E,F). Scale bars are given for time course in A,C and F. (G) Comparison of pH 8 to pH 6 V50 shifts for NvEag, MmEag1 and NvEag G302D with and without 5 mmol l−1 Mg2+. Shifts were calculated as the differences in average V50 values at pH 8 and pH 6. (H) Comparison of 5 mmol l−1 Mg2+-induced V50 shifts for NvEag, MmEag1 and NvEag G302D at pH 8 and pH 6 calculated from comparison of V50 values determined at 0 mmol l−1 Mg2+ and 5 mmol l−1 Mg2+. Data points in B,D,F–H are means ± s.e.m. (n=6–11).

