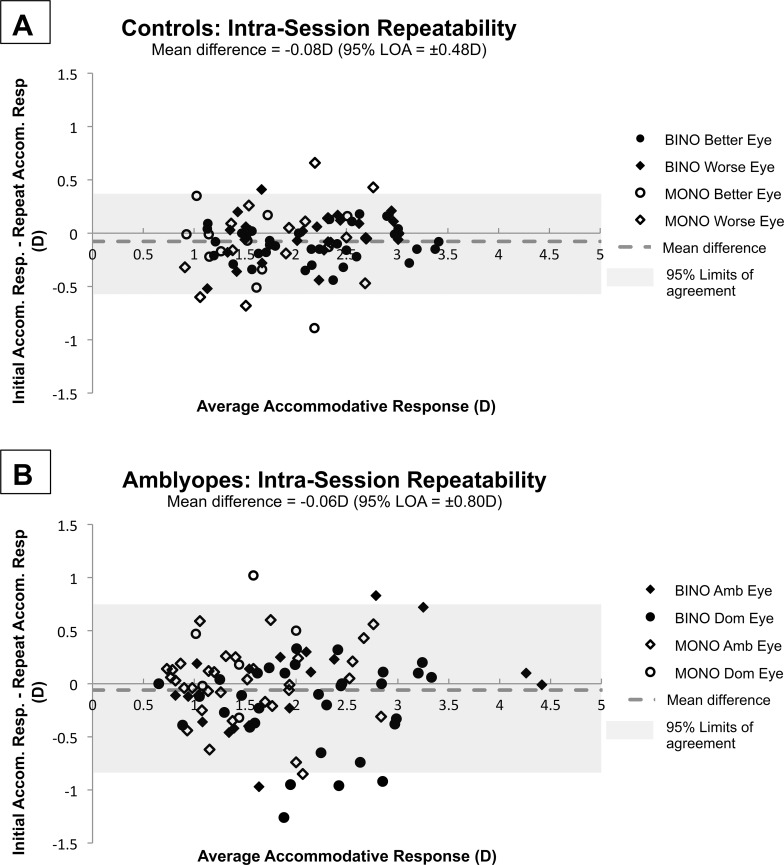
Figure 5.
Bland-Altman style plots,33 where the difference between the initial and repeated intrasubject and intrasession Nott retinoscopy measurements are plotted against the average of the two measurements. Each subject provided repeatability data from one eye in either monocular or binocular viewing at 2D, 3D, and 4D demands. (A) Intrasession repeatability measurements from 16 control subjects. Mean difference was −0.08 D (LOA: ±0.48 D). (B) Intrasession repeatability measurements from 15 amblyopic subjects. Mean difference was −0.06 D (95% LOA: ±0.80 D).

