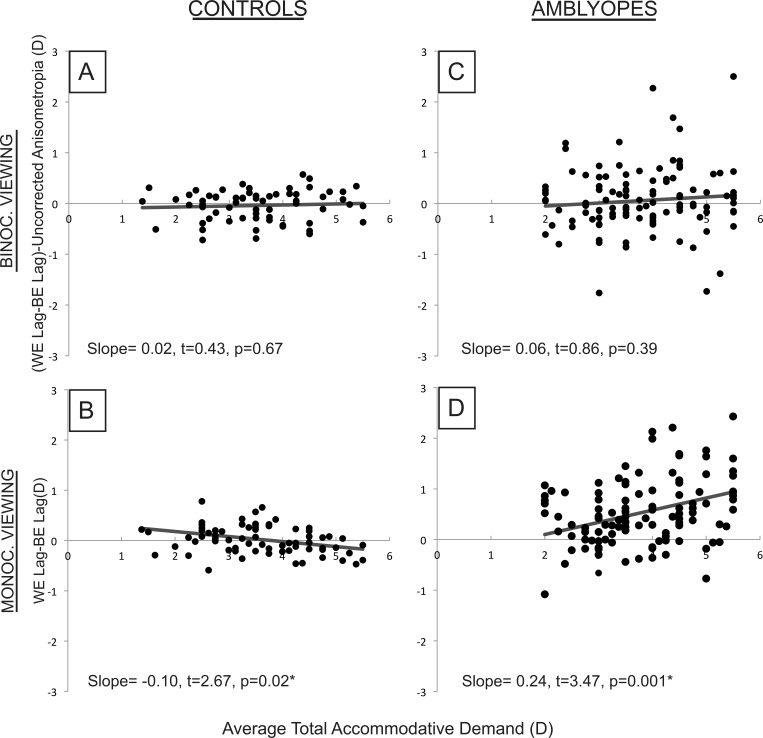
Figure 7.
Graph of interocular difference in accommodative lag (better eye/nonamblyopic eye subtracted from worse eye/amblyopic eye) plotted against the average demand for the two eyes for control (A, B) and amblyopic (C, D) subjects in binocular and monocular viewing, as measured in the 90° meridian.

