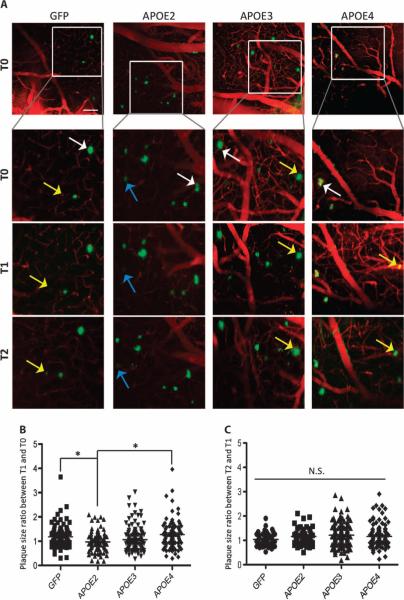
Fig. 4. Change in size of amyloid deposits 1 or 2 months after infusion with APOE2, APOE3, or APOE4.
(A) Representative images (maximal z projection of z stacks) of amyloid plaques (in green, detected after intraperitoneal injection of the amyloid fluorescent probe methoxy-XO4) that were longitudinally imaged for 2 months after AAV4 intracerebroventricular injection of APP/PS1 mice. Specific areas within each field of view were selected, and the same deposits could be followed over time. The cross-sectional area of each plaque was measured with ImageJ, and the ratio of the area between two time points was calculated (T1 versus T0 and T2 versus T1). Most amyloid deposits remained stable over time (white arrows), but some plaques grew (yellow arrows) or shrank (blue arrows). Scale bar, 100 μm. (B and C) Scatter dot plots representing the ratio of plaque sizes (B) between T1 and T0 and (C) between T2 and T1. n > 50 plaques measured per group of three to four animals. *P < 0.05 using two mixed-effects models fitted for log of the ratio of two consecutive time points, with random effects for mouse and fixed effects for log baseline size (T0 in the first analysis, T1 in the second analysis).

