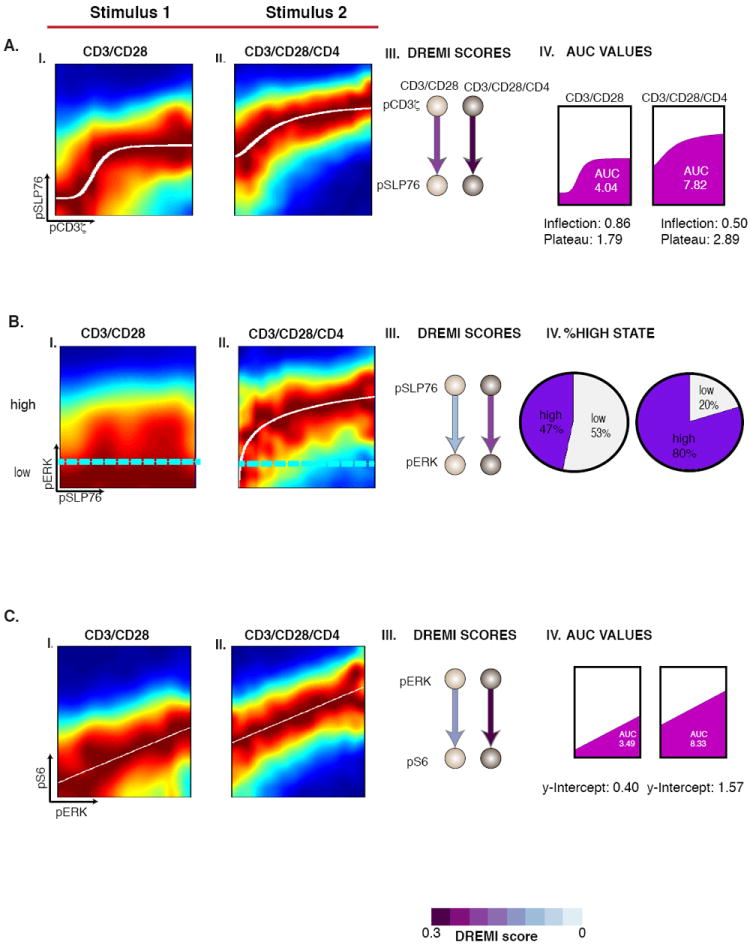
Figure 3. Comparison between stimulation conditions.

The cells are CD4+ naïve T-lymphocytes of B6 mice. (A) I-II) The pCD3ζ-pSLP76 edge at 30s after stimulation under both stimulation conditions. III) As stimulation strength increases, DREMI increases. IV) The inflection threshold moves to the left and the upper plateau of the response curve also increases resulting in a higher AUC. B) The pSLP76-pERK edge 2 minutes after stimulation. The cyan lines indicate a partitioning between “low” and “high” states of pERK. The pie charts in IV show increase in the percentage of cells that reach the high state at the higher dose. C) The pERK-pS6 edge has a linear edge-response function. Here, increasing stimulation strength results in an increase in DREMI shown in III and AUC, shown in IV.
