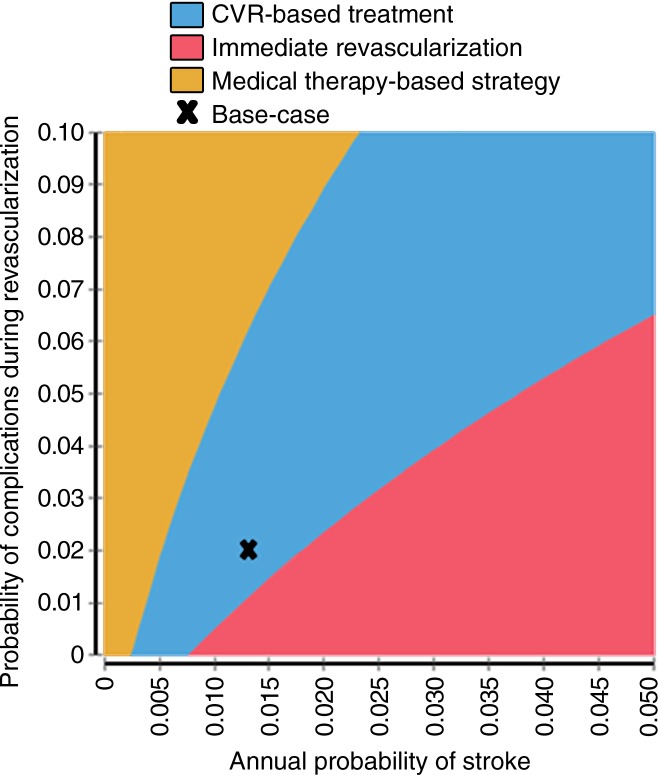
Figure 3:
Graph of two-way sensitivity analysis shows optimal strategy for different combinations of baseline stroke risk and probability of complications during revascularization. CVR strategy is optimal in the blue region, which includes base-case result (marked by an x); other strategies could be optimal given other combinations of stroke risk and revascularization complication risks.

