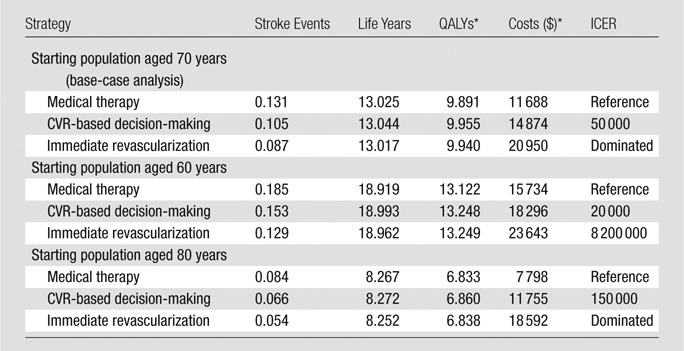
Table 3.
Lifetime Per-Person Cost-effectiveness Results for Patients Starting at 50%–69% Stenosis

Note.—In cost-effectiveness analysis, a “dominated” strategy has higher costs and worst health outcomes compared with a competing strategy.
Discounted at 3%.
