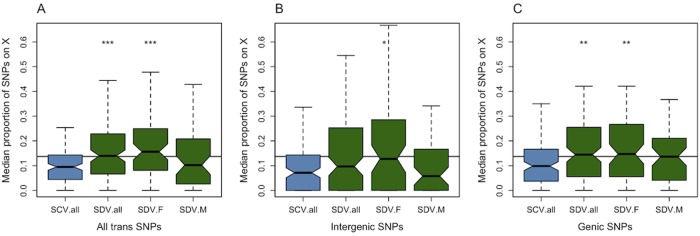
Fig 1. Genomic distribution of trans-acting SNPs.

Average proportion of SNPs situated on the X chromosome that associate with SCV and SDV genes (A) all trans-SNPs (B) intergenic SNPs (C) genic SNPs. SCV.all = all SNPs associated with SCV genes, SDV.all = all SNPs associated with SDV genes, SDV.F = SNPs with female-biased effect size associated with SDV genes, SDV.M = SNPs with male-biased effect size associated with SDV genes. * denotes P < 0.05, ** P < 0.01, *** P < 0.001 comparing SCV.all to SDV SNPs. The line represents the proportion of SNPs on the X chromosome.
