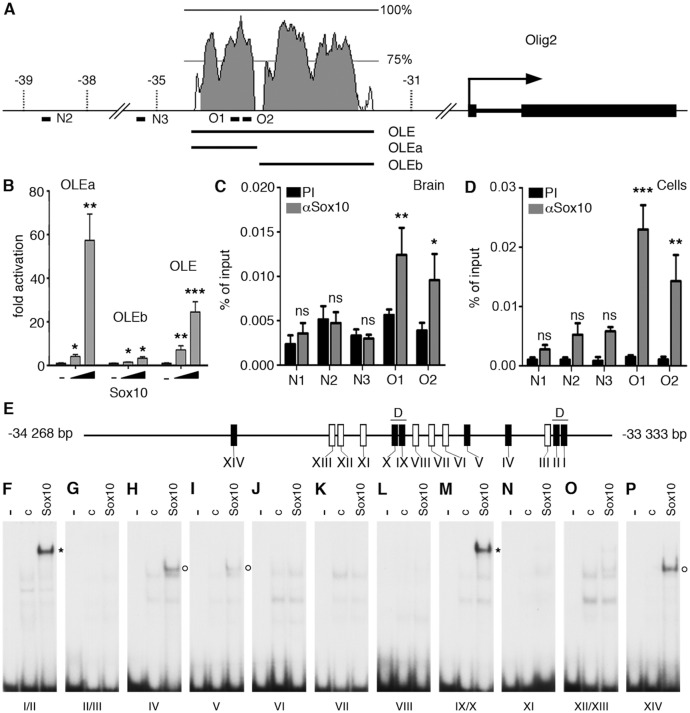
Fig 6. The evolutionary conserved OLE and its OLEa subfragment are directly activated and bound by Sox10.
(A) Shown are position and conservation profile (from 50% to 100% between mouse and human) of the evolutionarily conserved OLE enhancer within the mouse Olig2 genomic locus. Olig2 exons are shown as black boxes. Numbers refer to the distance in kbp relative to the transcriptional start site (marked by arrow). OLE subfragments OLEa and OLEb and the position of PCR fragments N2, N3, O1, O2 for ChIP studies are highlighted. (B) Sox10-dependent activation of OLE and its subfragments was studied in Neuro2a cells by cotransfection of increasing amounts of Sox10 expression plasmids (50 ng and 500 ng per 3.5 cm plate) with reporter plasmids that carried the luciferase gene under control of a minimal promoter in combination with OLE, OLEa or OLEb. Luciferase activities were determined in four experiments each performed in duplicates. The activity obtained for the luciferase reporter in the absence of ectopic transcription factor was arbitrarily set to 1. Fold inductions for Sox10 were calculated in relation and are presented as mean ± SEM. Activation of luciferase reporters by Sox10 was statistically significant in all cases (Student’s t-test; *, P ≤0.05; **, P ≤0.01; ***, P ≤0.001). (C, D) ChIP was performed on brain of three weeks old mice (C) and primary cultures of differentiated oligodendrocytes (D) using antibodies directed against Sox10 (αSox10) and control preimmune serum (PI). Quantitative PCR was applied on the immunoprecipitate to detect regions O1, O2, N2 and N3 from the Olig2 genomic region as well as N1 from rat chromosome 9q38 or syntenic mouse chromosome 17qE5. Values for each fragment correspond to the percentage of material precipitated from the input and represent the mean ± SEM of four biological replicates. Statistical significance of amounts precipitated with αSox10 relative to PI was determined by two way analysis of variance (ANOVA) with Bonferroni post tests (ns, not significant; *, P ≤0.05; **, P ≤0.01; ***, P ≤0.001). (E) Within OLEa (positions-34268 to-33333 relative to the Olig2 transcriptional start) 14 potential binding sites I-XIV were detected (see also Fig. 7). Of these sites only I, II, IV, V, IX, X, and XIV bound substantial amounts of Sox10 in vitro (black boxes) either as dimers (I/II and IX/X, marked by D) or monomers (IV, V, XIV). (F-P) EMSA was performed with radiolabelled double-stranded oligonucleotides encompassing one or two closely spaced putative Sox10 binding sites from OLEa. Oligonucleotides were incubated in the absence (-), or presence (c, Sox10) of protein extracts before gel electrophoresis as indicated above the lanes. Extracts were from mock-transfected HEK293 cells (c) or HEK293 cells expressing full length Sox10 (Sox10). Oligonucleotides with site B and site C/C‘ from the promoter of the Mpz (myelin protein zero) gene served as positive control for Sox10 monomer and dimer binding [48]. Positions of bands indicative of Sox10 binding are marked by asterisks for dimers and circles for monomers.

