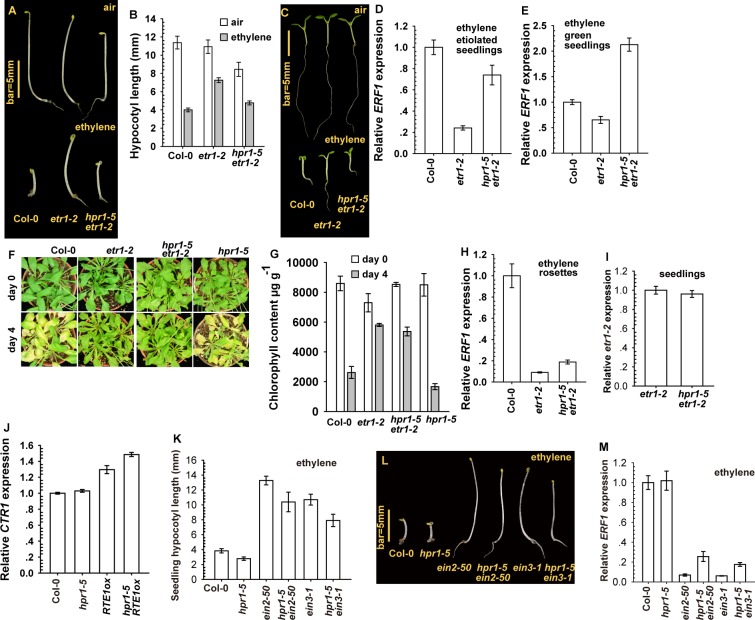
Figure 3. The hpr1–5 allele suppressed etr1–2 ethylene insensitivity at the seedling stage.
Etiolated seedling phenotype (A), hypocotyl measurement (B), and light-grown seedling phenotype (C) for etr1–2 and hpr1–5 etr1–2. ERF1 expression in etiolated (D) and light-grown (E) seedlings of etr1–2 and hpr1–5 etr1–2. Leaf senescence phenotype (F) and chlorophyll content (G) in etr1–2 and hpr1–5 etr1–2 plants. (H) ERF1 expression in etr1–2 and hpr1–5 etr1–2 rosettes. Expression of etr1–2 (I) and CTR1 (J) is not reduced by the hpr1–5 mutation. Measurement (K) and phenotype (L) of hypocotyls of etiolated seedlings of ein2–50 and ein3–1 mutants with and without the hpr1–5 allele, and ERF1 expression in these genotypes (M). Data are mean±SD seedling hypocotyls (n>30) and chlorophyll content (n>3), and mean±SE for gene expression (at least 3 independent biological samples with 3 measurements for each). Ethylene concentrations are 10 μL L-1 for ERF1 induction and 100 μL L-1 for the leaf senescence test.

