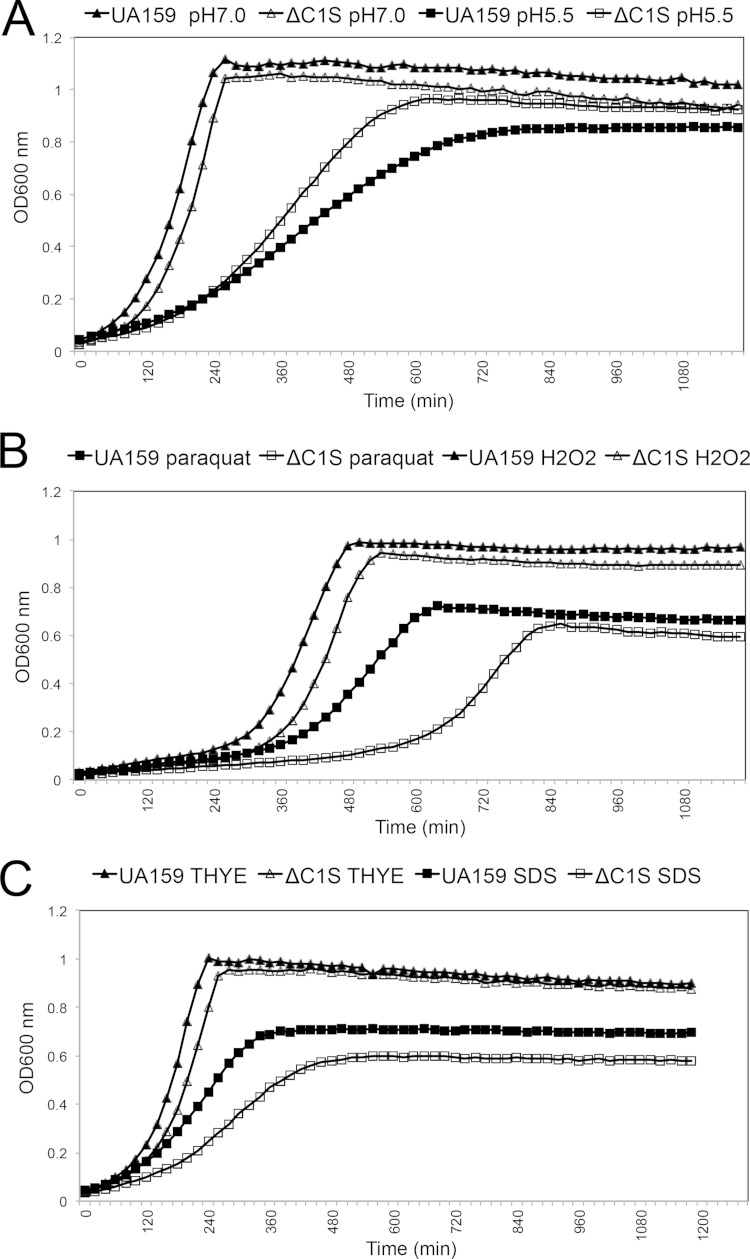
FIG 6.
Growth kinetics of S. mutans UA159 and ΔC1S under various stressors: pH 7.0 or 5.5 (A), 25 mM paraquat or 0.003% H2O2 (B), and THYE or 0.004% SDS (C). Each point represents the average of four independent optical density values per sample. These results shown are representative of two independent experiments conducted with the mutant and UA159 parent strain.

