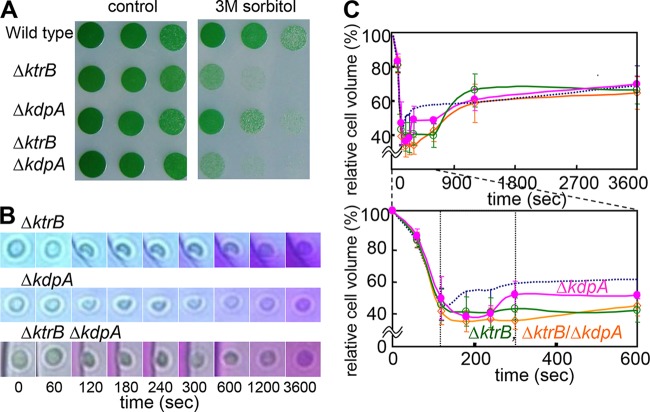
FIG 3.
Effects of disruption of ktrB and kdpA on the hyperosmotic stress response in Synechocystis cells. (A) Growth of Synechocystis wild type, ΔktrB mutant, ΔkdpA mutant, and ΔktrB ΔkdpA double mutant spotted onto standard BG11 medium with 1:5 serial dilutions from an OD730 of 1 after incubation in medium containing 3 M sorbitol for 0 h (left) or 4 h (right). (B) Representative time courses of single cells (ΔktrB mutant, ΔkdpA mutant, and ΔktrB ΔkdpA double mutant) inside the microfluidic device showing shrinkage and recovery after being subjected to hyperosmotic stress by replacement of the standard BG11 medium with the medium containing 3 M sorbitol at 0 s. (C) Profiles of volume changes of cells of the ΔktrB mutant (green), ΔkdpA mutant (pink), and ΔktrB ΔkdpA double mutant (orange) determined from the microscopy images taken by the camera attached to the microfluidic device. The bottom panel shows a subset of the data in the top panel (0 to 600 s). The dotted lines correspond to the volume changes of the wild type; the data are the same as are shown in Fig. 2G. Error bars denote SD of the results from 5 to 8 cells (Table 2).

