FIG 7.

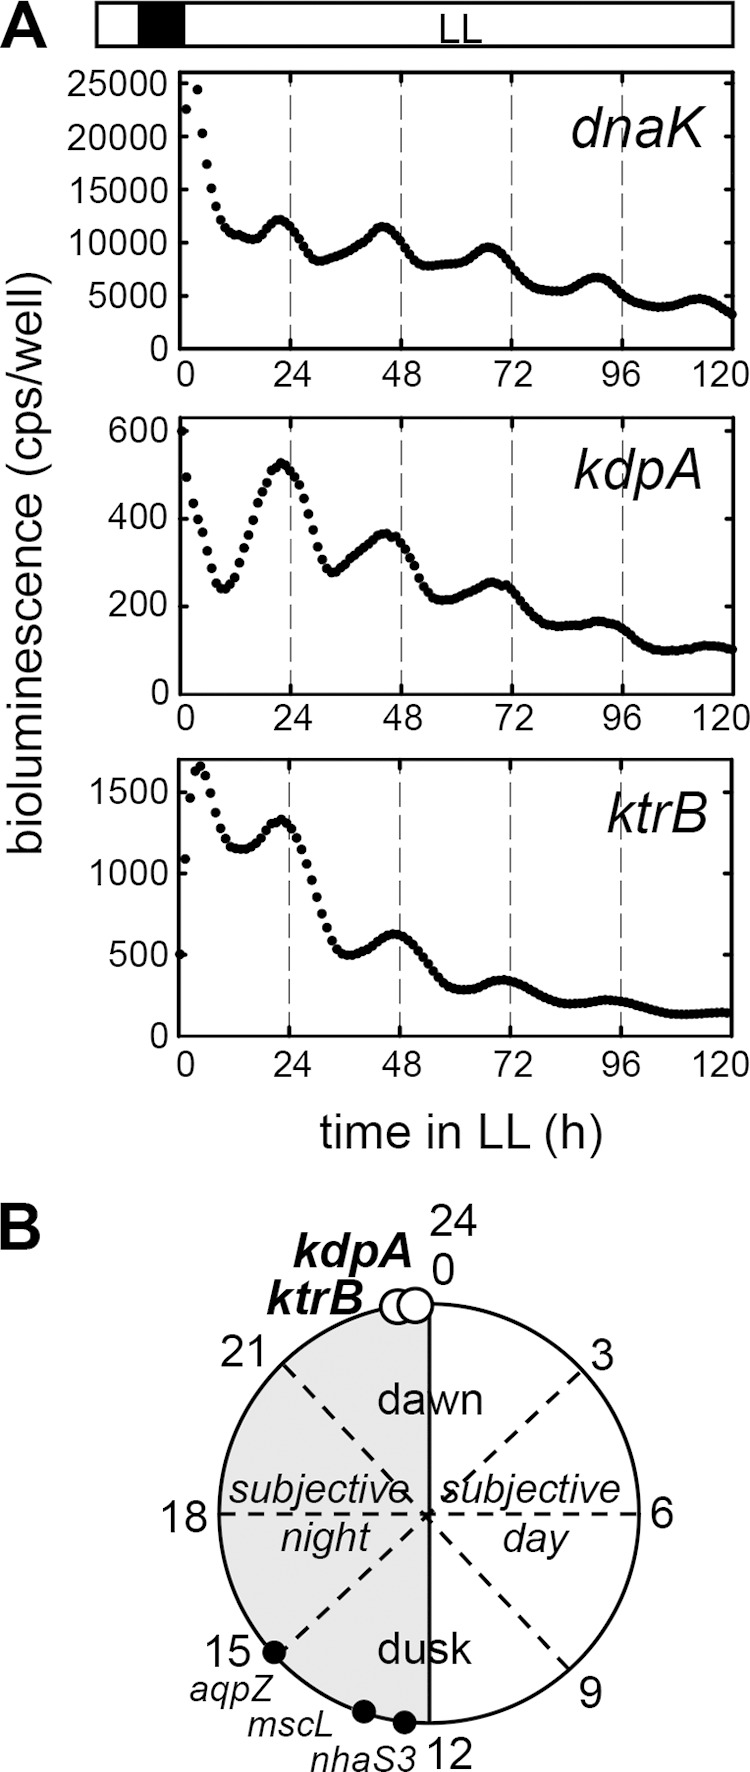
Circadian rhythm of kdpA expression in Synechocystis. (A) Representative circadian oscillation profiles of bioluminescence measurements from Synechocystis strains containing PdnaK::luc+, PkdpA::luc+, and PktrEB::luc+ are shown. The cell cultures were preincubated in the dark for 12 h (filled square) and then transferred to continuous light conditions (LL; open rectangle). Essentially the same profiles were obtained from three independent experiments. Detailed values are listed in Table 3. (B) Model of the circadian rhythm of kdpA and ktrB expression in Synechocystis. The expression peaks of the genes encoding the membranous transport proteins kdpA and ktrB are marked by open circles at the corresponding circadian times. The previously reported peaks of aqpZ (aquaporin) (57), nhaS3 (Na+/H+ antiporter) (56), and mscL (mechanosensitive channel large conductance) (58) are also indicated (filled circles).
