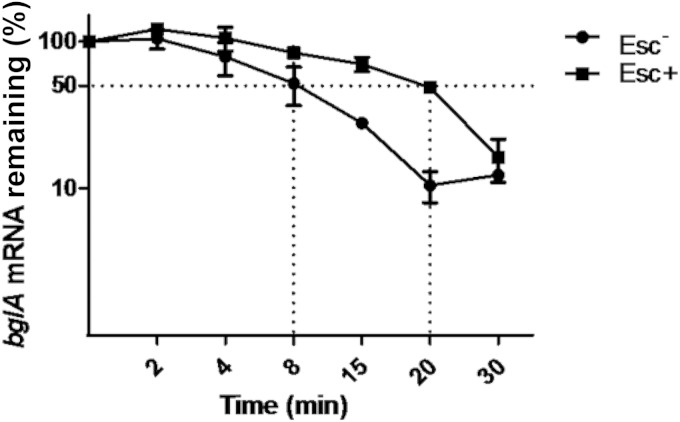
FIG 5.
The relative levels of bglA mRNA plotted against time in the Esc− parent strain SD-3.12 ΔascB and in the Esc+ mutant. The levels of bglA mRNA at different time points after rifampin treatment were analyzed by semiquantitative RT-PCR. The percentage of mRNA remaining relative to mRNA from untreated cultures (0 min) at each time point was plotted on the y axis versus time on the x axis.

