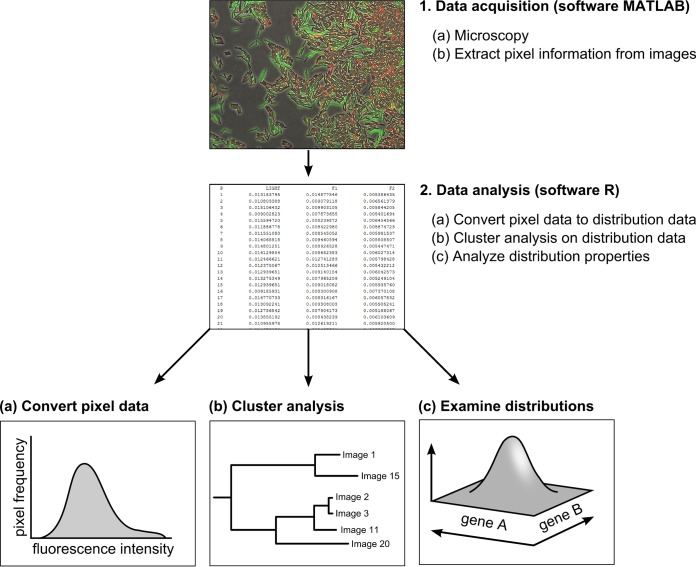
FIG 1.
Overview of work flow. Schematic diagram of work flow consisting of two steps: data acquisition in MatLab (step 1) and data analysis in R (step 2). In the first step, microscopy images are converted to tables containing the fluorescent values of pixels associated with cells. In the second step, data are analyzed by converting pixel information (fluorescence intensity per pixel as a proxy for gene expression) (a), performing cluster analysis (b), and examining the gene expression distributions (c).

